
SUNSCAPES
A collection of images that were shown at the National Academy of Sciences in 2002
A collection of images that were shown at the National Academy of Sciences in 2002
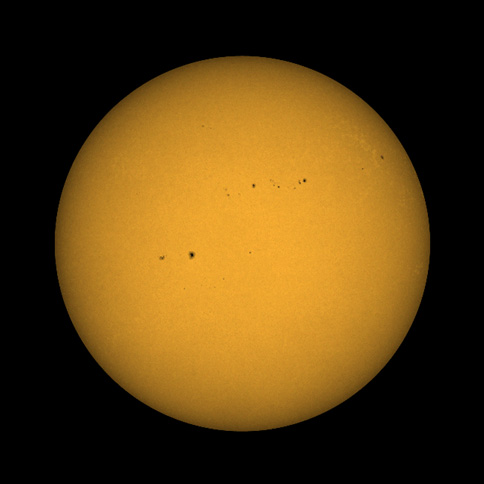
We can trace the effects of the Sun's magnetic field by observing it at different wavelengths that reflect different temperatures. The gas at the Sun's surface has a temperature around 10,000şF, which causes it to glow at visible wavelengths. Sprinkled across the solar surface are dark patches, or sunspots, where particularly strong magnetic field has surfaced; these are dark because the temperatures in their interiors are lower (typically as low as 6,000ş F). Surrounding the spots we see patterns that are slightly brighter than the rest of the surface. These so-called faculae reveal where smaller clusters of magnetic field break through the surface.
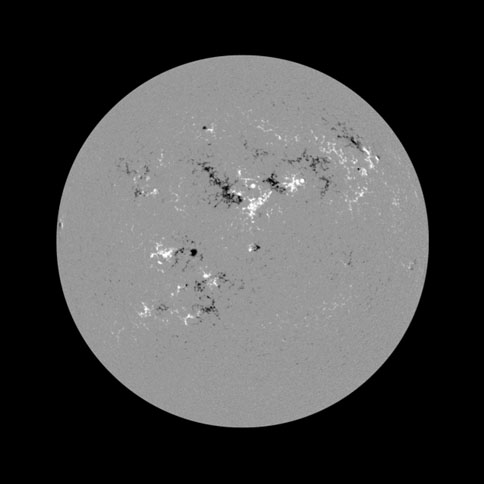
The magnetic field at the surface of the Sun can be measured by looking at the Sun with polarized filters that are tuned to very narrow spectral pass bands (color ranges). This image shows regions of north magnetic polarity as bright, and regions of south polarity as dark.
Comparison with the image taken in visible light shows that the dark sunspots correspond to compact, strong clusters of magnetic field, while the brighter patches of faculae trace the weaker, more fragmentary magnetic field. The magnetic field causes the outer atmosphere of the Sun to glow at a range of colors, as shown in the other images in this set.
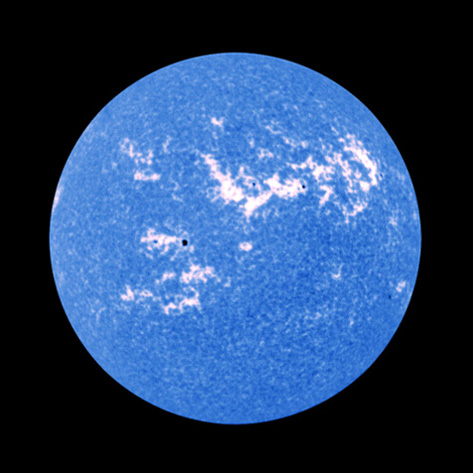
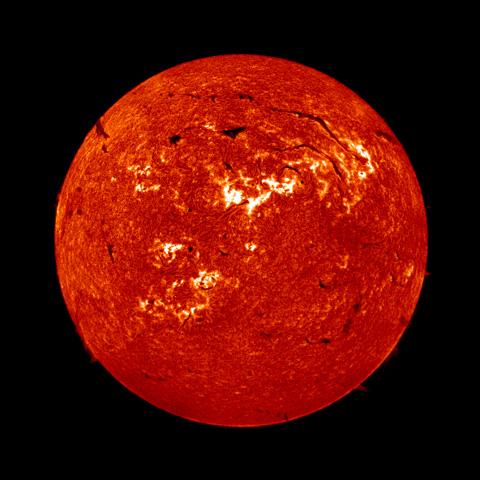
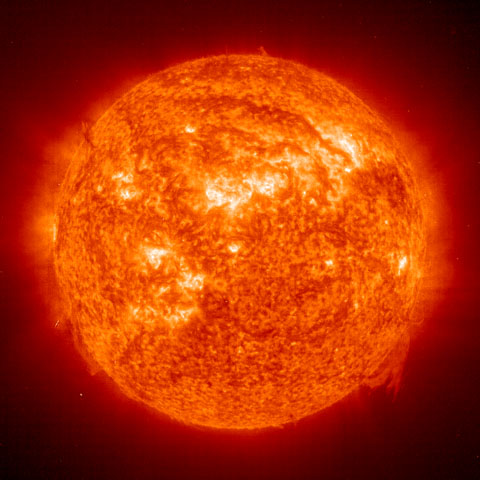
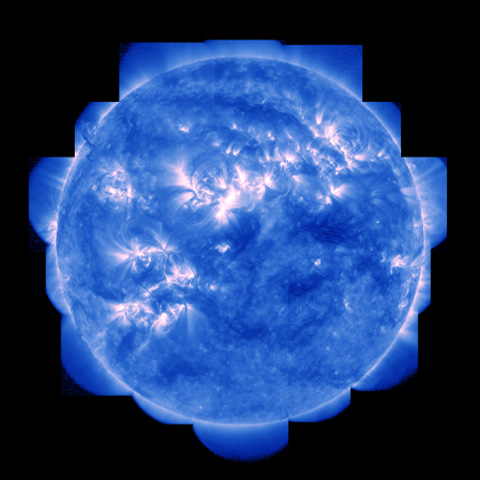
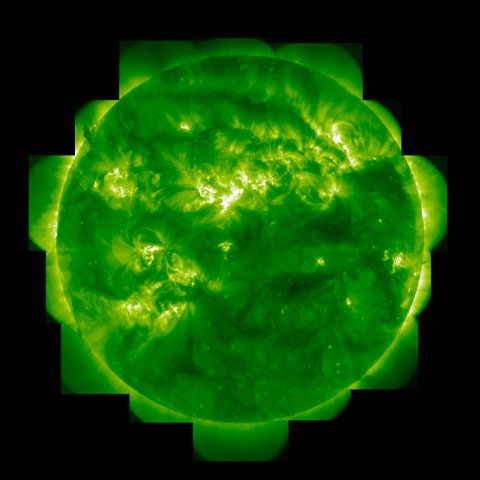
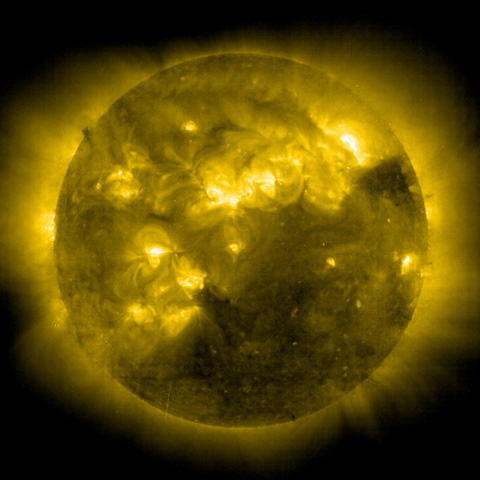
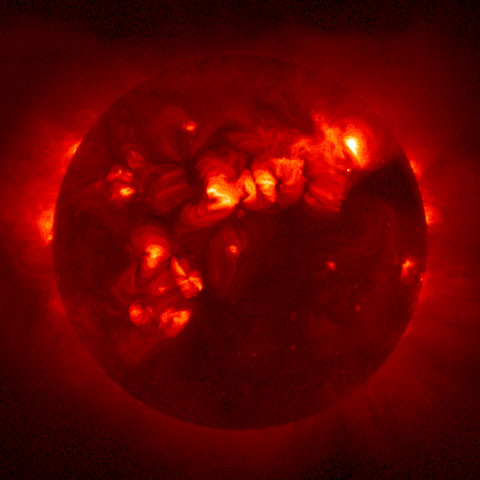
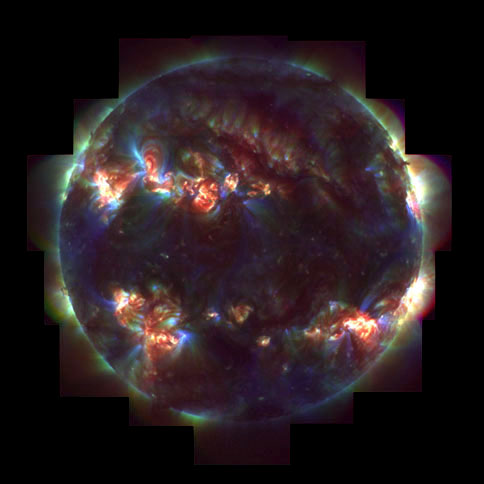
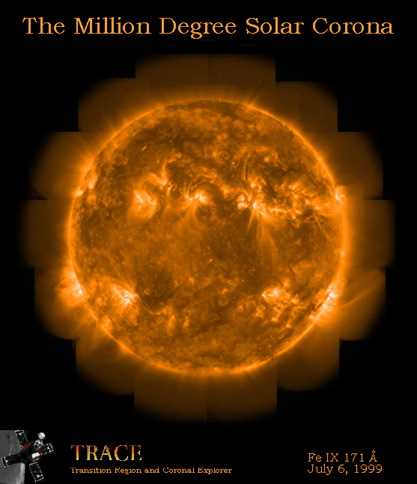
Strong magnetic field penetrates the solar surface heat the outer atmosphere. Within the first 4,000 miles above surface, the temperature within the magnetic field nearly doubles from about 10,000ş F to 18,000ş F and the gas glows in light of calcium (image 3, in blue) and hydrogen (image 4, in red), both visible to the unaided eye, and observable from the ground. To observe hotter gases we have to go to space. The next five images show the Sun at very different temperatures. Image 5 (orange) is observed in light from ionized helium (He II) at 50,000ş F. The blue image (number 6) shows emission from gas at 2 million Fahrenheit, in light from ionized iron (Fe IX/X). The green image (number 7) shows the corona in light emitted by gas 3 at million degrees (Fe XII), and the yellow image (number 8) in light from gas at 4 million degrees (Fe XIV). The red image (number 9) is an X-ray picture of the Sun, revealing emission from gas at 6 to 10 million degrees.
Comparison of these images shows that temperature regions in the outer atmosphere of the Sun exist side by side at a variety of heights. This is a consequence of the high degree of localization of the heating processes, which allow regions that are close to one another to be very different in temperatures. The video screens in this exhibit show that the structures are also highly variable on time scales from seconds to hours. The temporal and spatial variations of the images provide critical clues to the processes that heat and destabilize the solar atmosphere.
Images: ESA/NASA Solar and Heliospheric Observatory (1, 2, 5, 8), the Transition Region and Coronal Explorer (6, 7), the Japanese-American YOHKOH satellite (9), and by the Big Bear Solar Observatory (3, 4) – all on 8 February 2001, within hours of each other.
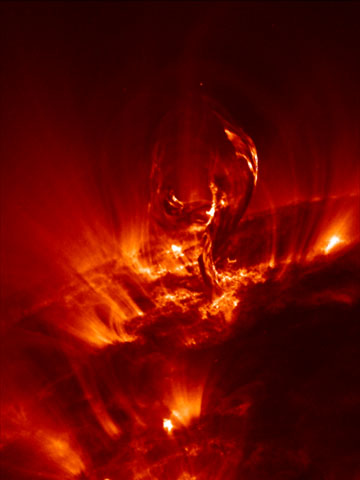
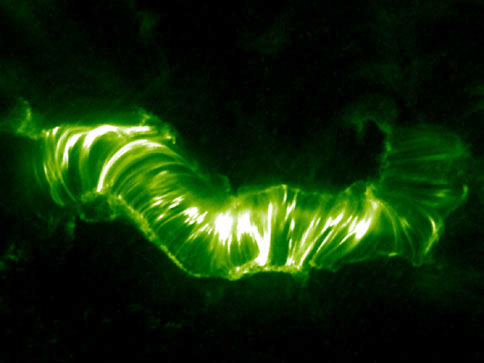
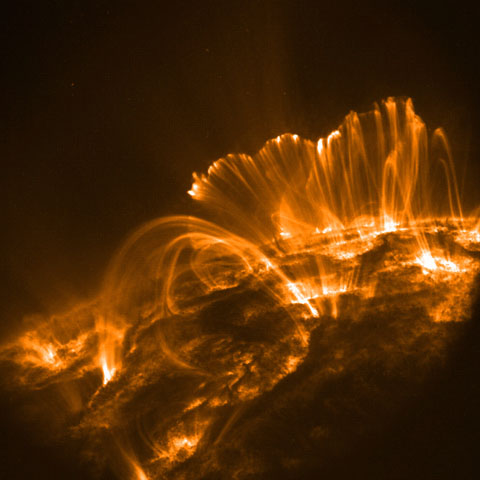
The magnetic activity of the Sun causes all space weather. Some of the most violent space storms result from coronal mass ejections, sometimes associated with large flares. The first image (in green) shows a magnetic arcade, glowing as it cools down from many millions of degrees to a mere one or two million degrees, after a large amount of relatively cool gas in the form of a filament erupted through it. Another such cooling arcade is shown in the gold-colored image, now seen from the side.
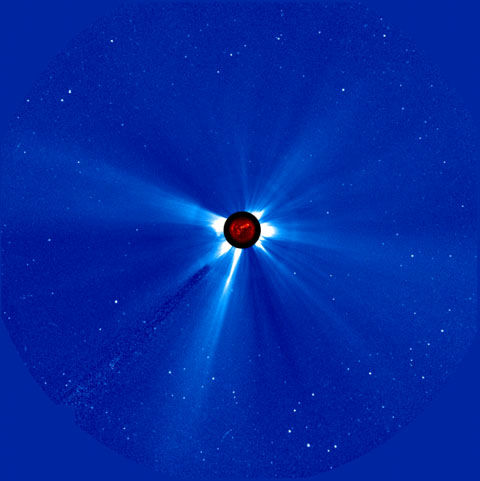
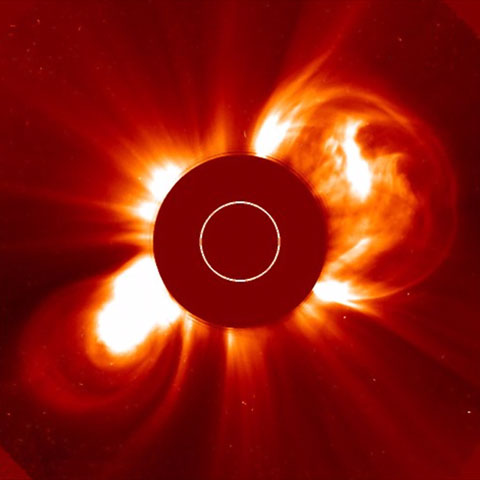
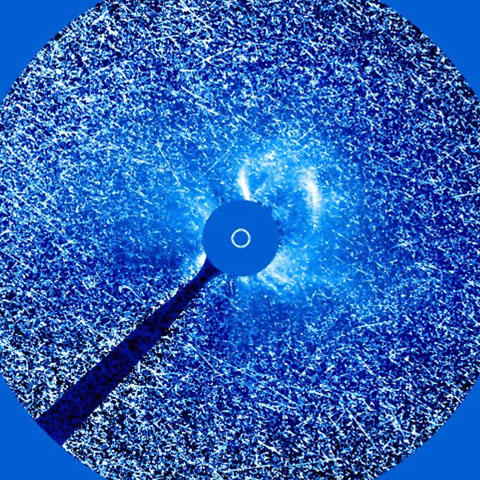
Coronal mass ejections blow big bubbles in the solar wind, with relatively dense shells around them as they plow through the gas. One such eruption is shown in progress in the red image; here the Sun was blocked out by a disk built into the telescope, so that the faint emission from the ejection could be seen (the white circle in the center shows the size of the Sun). When this gas, and the magnetic field that comes with it, impact the Earth's magnetic field, space storms occur that can damage or disable spacecraft and may even cause disruptions in power grids on Earth. Such storms generally cause aurorae, such as seen in the composite of six images of the polar regions of the Earth viewed from space. Eruptive events taking off from the Sun are often associated with dangerous clouds of particle radiation: when they pass through a sensitive detector (as in the blue SOHO/LASCO image, again with the Sun itself blocked out by a disk) they may look like snow, but they can knock out spacecraft components, or cause serious harm to astronauts.
Images: Transition Region and Coronal Explorer, the LASCO instrument on the ESA/NASA Solar and Heliospheric Observatory, and the Earth-observing IMAGE spacecraft.
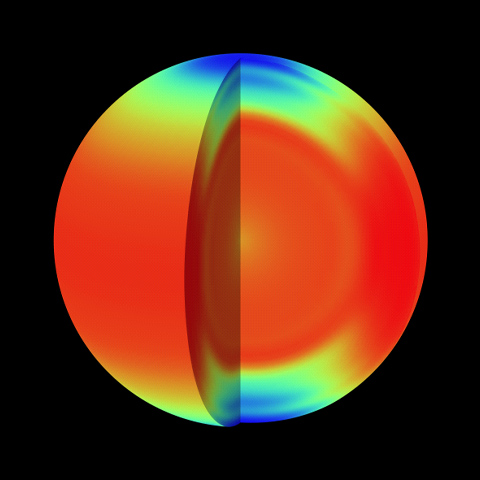
Sound can often penetrate where light cannot: like a medical ultrasound, sound waves are used to probe the Sun's deep interior. Temperature and density of the interior can be measured and the gas flows throughout the interior can be mapped.
This image, made with helioseismic analysis methods applied to SOHO/MDI data, shows the average wind speed in the east-west direction from the surface to the deep interior. The colors indicate the east-west rotation rate, where red is faster and blue is slower than average. The gas near the poles spins around the rotation axis some 25% slower than the equator and the deep interior. (The equatorial regions move around with a speed of close to 500 miles per hour.) Helioseismology has shown us that the wind pattern seen at the surface, called the differential rotation, persists to the bottom of the convection zone, at approximately 30% of the radius below the surface.
The cutout shows that the interior of the convection zone rotates with a pattern similar to that seen at the surface, with wind speed dependent on latitude. But the deep interior, i.e. the radiative zone where the gas shows no convective bubbling, shows little rotational structure. It almost rotates as if it were a solid body. Its rotation rate is the average of that observed at the differentially rotating surface
Neither the shape of the differential rotation of the envelope, nor the nearly uniform rotation or relatively slow rate of the deep interior was expected from theoretical models: helioseismology corrected the course of astrophysical theory.
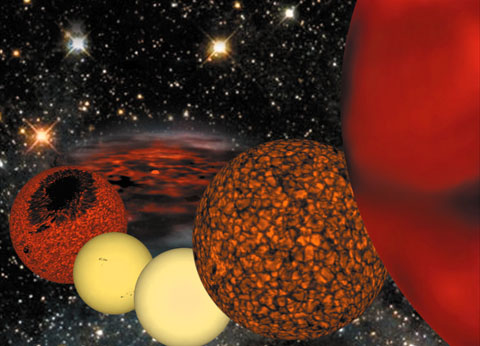
This graphic rendering shows the Sun over its 10-billion year lifetime. The Sun formed out of a gaseous, slowly spinning disk of material: in its core a star formed, in its outer reaches the planets condensed. For some tens of millions of years, the Sun was a slowly shrinking orange ball of gas, with lots of big sunspots, some even showing up at the rotational poles.
We are in about the middle of a 10 billion-year period of steady shining as a yellow star, with slowly decreasing magnetic activity. In another 5 billion years or so, the Sun – now having almost completely lost its magnetic activity - will be out of hydrogen fuel; it will swell into a red, giant star a hundred times larger than today, quickly burning the little hydrogen left in the outermost layers. After that it will turn into a tiny white dwarf (not shown here, because it would be but a tiny dot), slowly cooling down and fading away.
Image: Karel Schrijver (Lockheed Martin Advanced Technology Center).
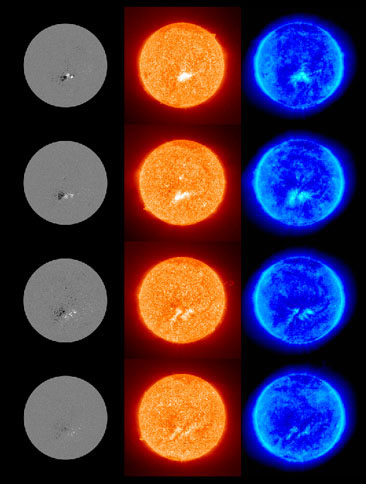
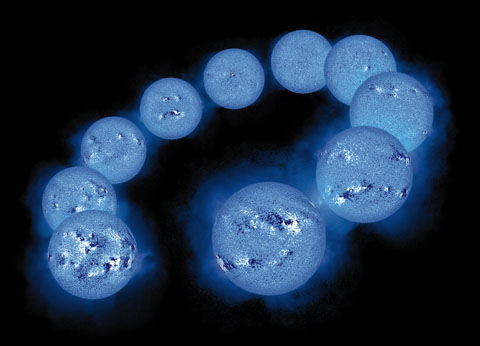
Sunspots and their associated magnetic fields follow an 11-year cycle. The composite image on the left shows ten magnetic maps of the Sun approximately one year apart, from one maximum of activity almost to next. As activity fades, the large regions disappear and only small ones continue to emerge, creating a salt-and-pepper pattern of ephemeral magnetic regions that persists through time. As the next cycle of activity picks up, the magnetic polarities of the active regions are reversed. This means that although the sunspot number and the coronal activity have an eleven-year cycle, the full magnetic cycle is actually twenty-two years.
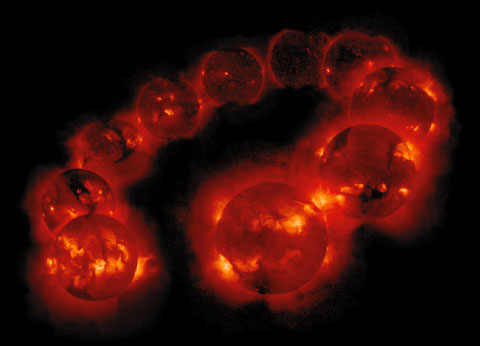
Wherever strong magnetic fields penetrate the solar surface, the outer atmosphere is heated to several million degrees. The composite image on the right shows the X-ray emission from this hot corona. As the cycle fades out, the X-ray emission becomes weaker and more diffuse, to brighten again as the next cycle starts.
Images: Japanese-American YOHKOH satellite (corona); Kitt Peak telescope of the National Solar Observatory (magnetic maps).
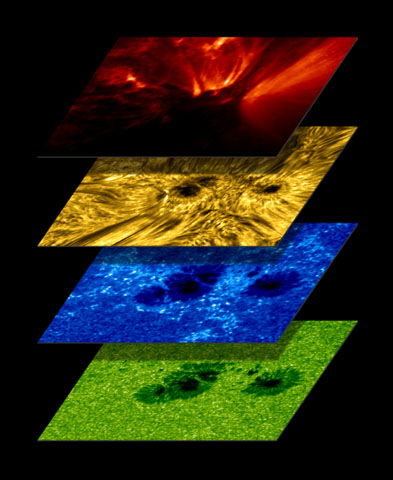
The Sun's magnetic field connects the different domains in its atmosphere. The bottom panel in this composite shows the visible surface, at about 10,000ş F, with dark sunspots where the field is strong and coherent, and faint bright kernels where the field is about half as strong and broken up. Around them the seething motions of the convection form tiny cells (about the size of Texas) called granules.
The second image shows the emission from the chromosphere, some 4,000 miles above the surface. It has a temperature of approximately 18,000ş F. The sunspots remain dark, but the smaller magnetic concentrations now emit much more brightly in the light of ionized calcium ions (Ca II K).
The third image shows the Sun in light of neutral hydrogen gas. Because hydrogen is the most abundant element in the Sun, its atoms contribute over a larger range of heights than images taken in the light of other elements at a comparable temperature. It is for that reason that the image reveals segments of the magnetic field with a three-dimensional character, rather than appearing as a thin slice through a fixed level in the atmosphere. Here the fields can be seen to lean away from the strong field in the sunspot in the center.
The top image shows the corona, with emission from gas at a million degrees. The atmosphere is completely transparent at these wavelengths, so we see the field at a range of heights, thus revealing fans and curtains of emission from hot, ionized captured within the magnetic field.
Images: Swedish Solar Observatory on La Palma, Spain (lower three), and with the Transition Region and Coronal Explorer (top).
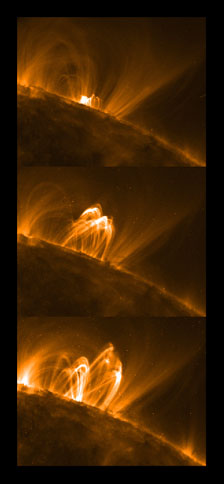
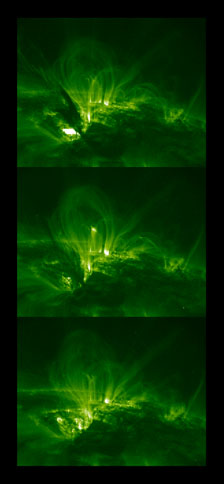
Nothing is static on the Sun, least of all the corona. These three images of a magnetically active region seen at the edge of the Sun, span only two and a half hours, yet look completely different. Each of the loop-like structures, outlining the magnetic field by the glowing of million-degree gas, changes in position, in density, and in temperature, resulting in a beautiful yet extremely complex atmosphere.
Image: Transition Region and Coronal Explorer (in light of ionized iron; Fe IX/X).
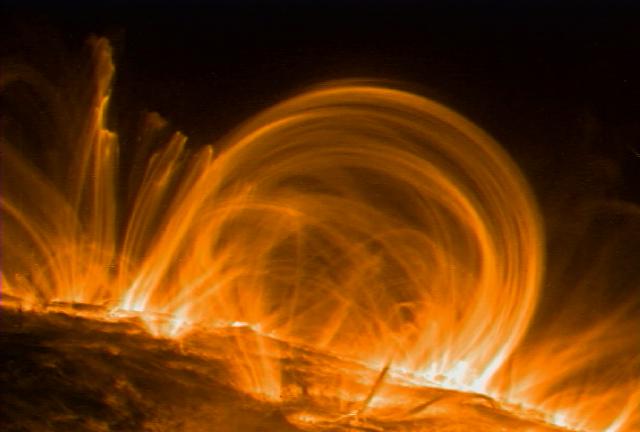
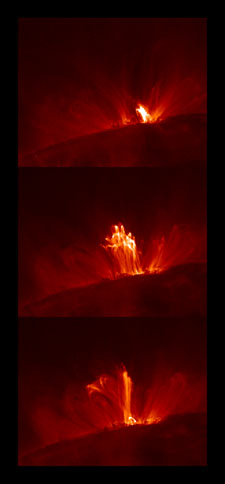
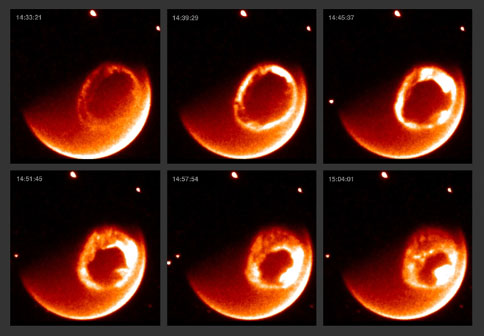
Relatively cool, absorbing gas lifted by the untwisting magnetic field is embedded within the hot, glowing corona (mostly at two million degrees Fahrenheit in this image). The cool gas then slides back down to the solar surface along the magnetic field. If this eruption had had a little more momentum, much of the relatively cool mass would have been thrown off into interplanetary space in a coronal mass ejection.
Image: Transition Region and Coronal Explorer.
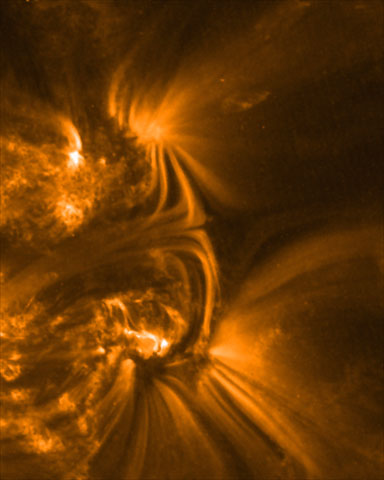
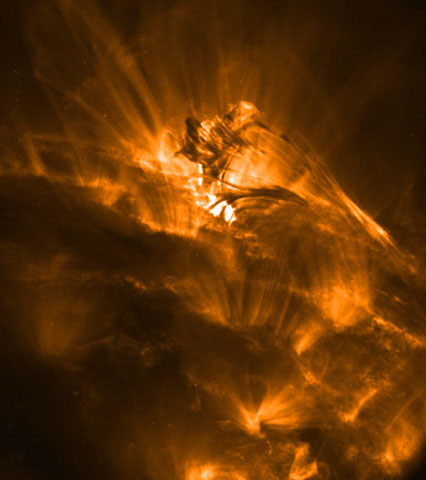
Most of the solar corona is made up of glowing loops of hot material that outline a magnetic field extending from one polarity to its opposite at the surface. Where magnetic fields from two or more magnetically active regions are comparable in strength but opposite in direction, the fields deflect each other and a so-called X point forms. The field strength goes to zero at the crossing point of the X. Solar physicists believe that much of the action in the corona occurs at such points, despite the fact that configurations as clear as this one are rarely seen.
Once the magnetic field is at the surface of the Sun, it spreads out in response to the evolving winds of the convective motions and large-scale flows systems. The top image on the left shows the magnetic field of an active region just after it first appeared on the surface. The three images below it show the field being dispersed across the Sun on four consecutive solar rotations, roughly one month apart.
The central column shows the emission from above the surface, at about 50,000 degrees. The emission is brightest where the field is strongest. The patches of emission are gradually stretched and weakened, as is the field. A similar behavior is seen in the million-degree corona, shown in the right-hand column (Fe IX/X 171Å), where the three-dimensional loop-like structure of the field becomes apparent.
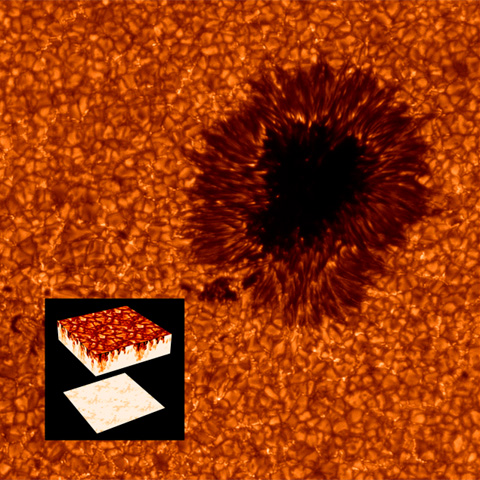
This high-resolution image reveals the multitude of convective cells, each about the size of Texas, that cover most of the solar surface. In these cells, hot, buoyant gas from the interior rises to the surface where it expands and cools. The cooler, denser gas slides towards the edges and eventually sinks down in the cooler, darker, network of the lanes. The pattern of convection changes wherever there is strong magnetic field. Where the magnetic field is concentrated in fairly strong, but relatively small clusters, we see it reside in the dark lanes, the downdraft regions of the convection. Many of these clusters of magnetic field form bright specks.
Inset: Computer simulations not only manage to recreate the surface appearance of the Sun, they also show us what probably happens below the surface. The sides and the reflection of the bottom of the computed cube show the patterns in the convection down to a few hundred miles below the surface. Gradually, the cellular network that we see at the surface is replaced by narrow, turbulent downdrafts embedded in slow, broad flows where relatively warm gas wells up to the surface.
Image: Swedish Solar Observatory, La Palma, Spain; inset: Ake Nordlund, Nordita (Copenhagen).