
 |
movie (6.4MB)
 |
 |
|
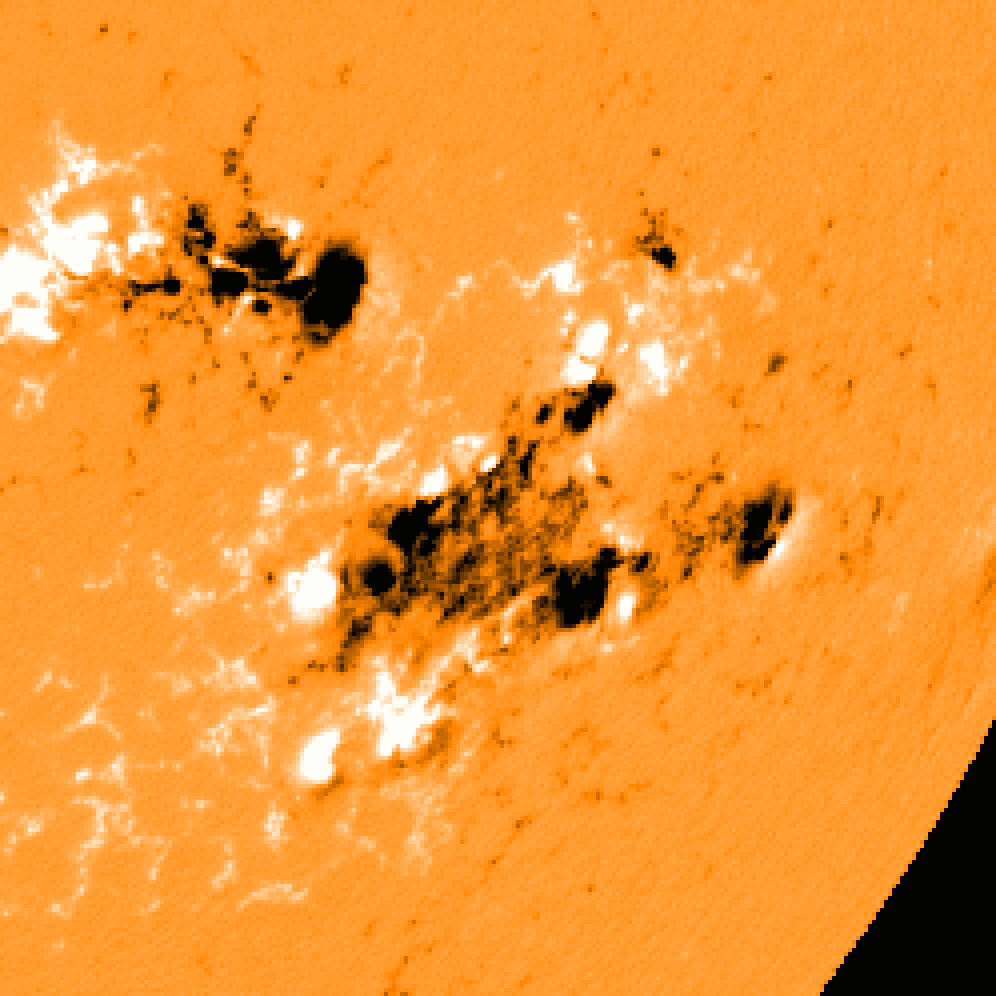 |
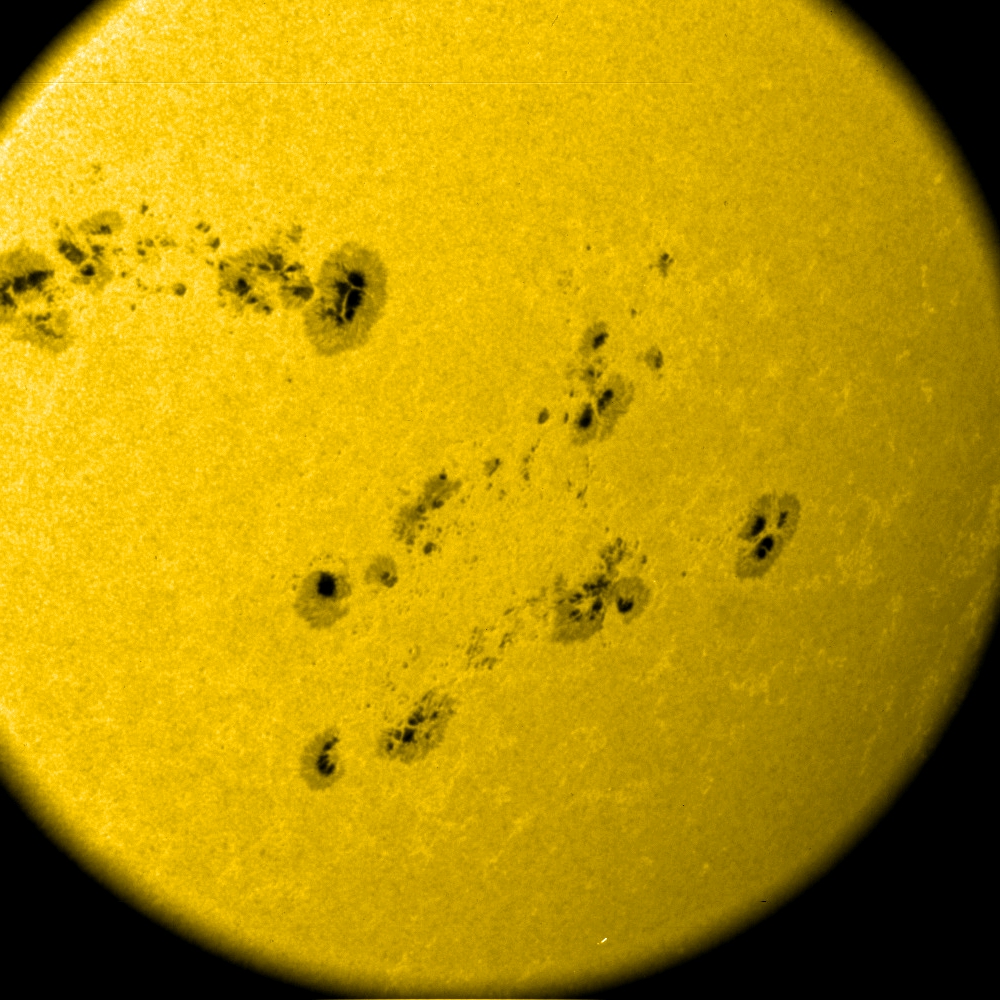
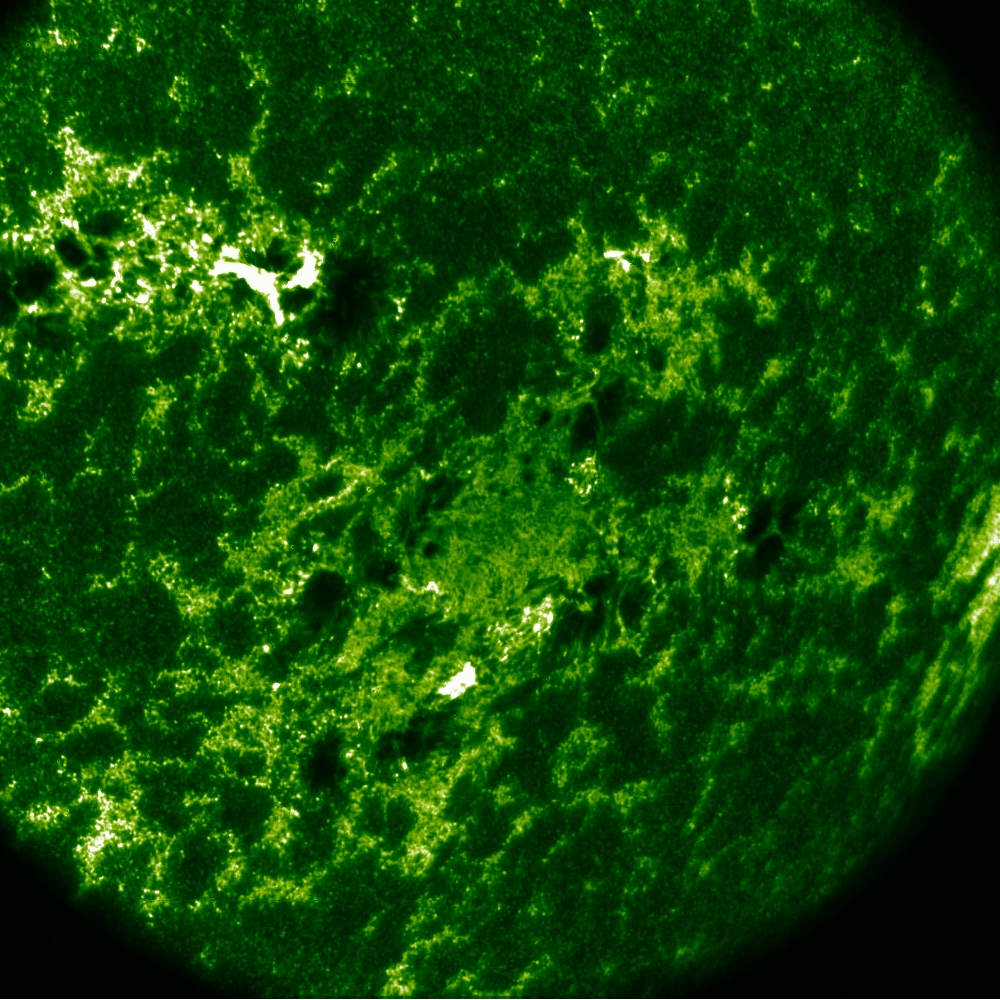
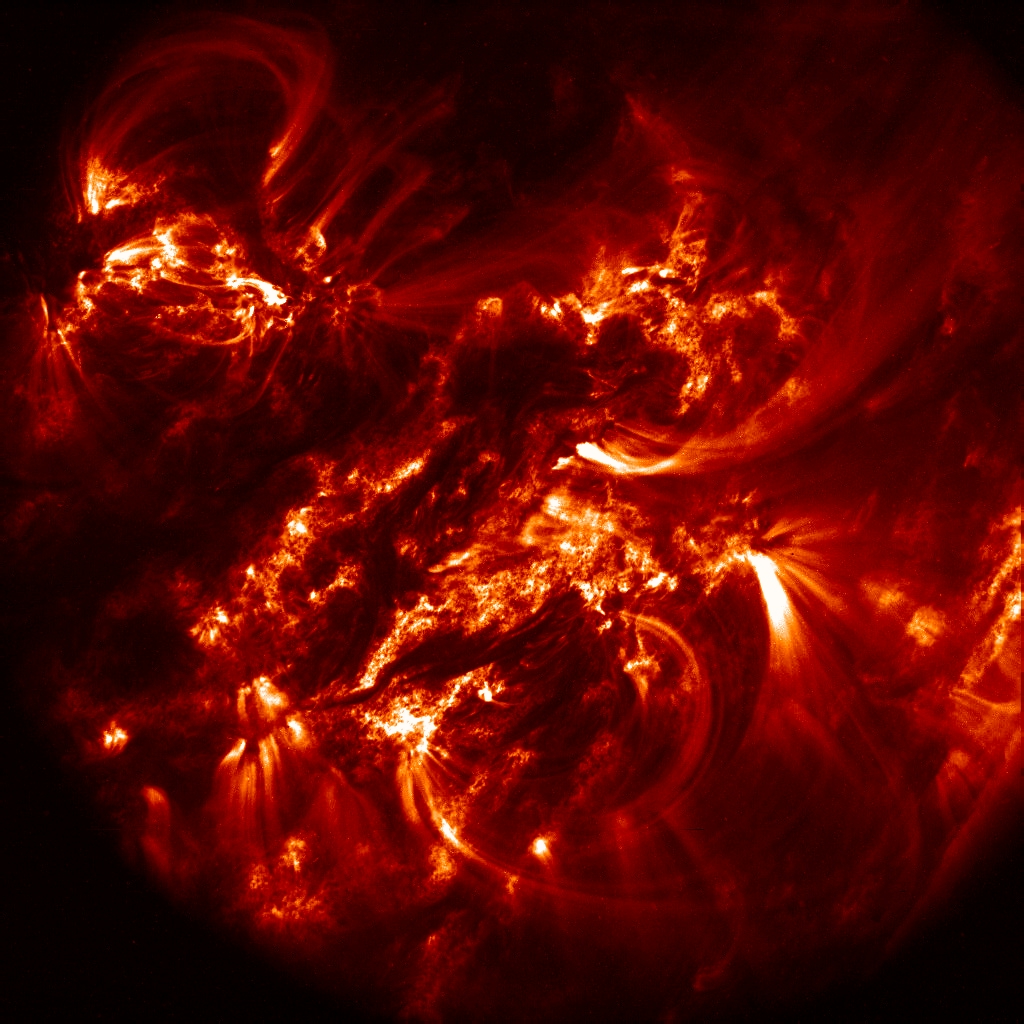
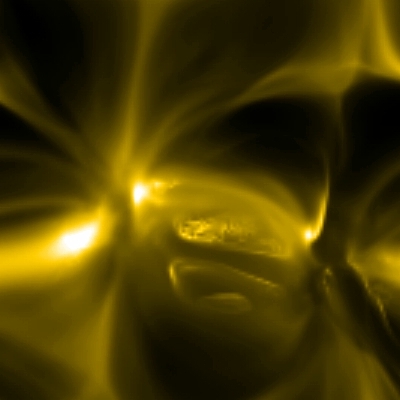
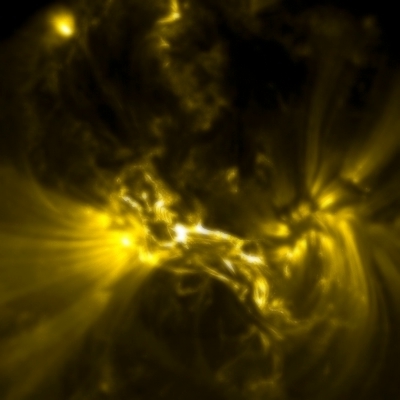
Images taken on 2002/07/31, from left to right: 1) Magnetogram by SOHO/MDI at 14:27:00 UT; 2) Surface seen in visible light (TRACE/WL) at 14:48:25 UT; 3) Transition Region (TRACE/1600Å) at 14:48:25 UT; 4) Corona (TRACE/171Å) at 14:48:25 UT. |
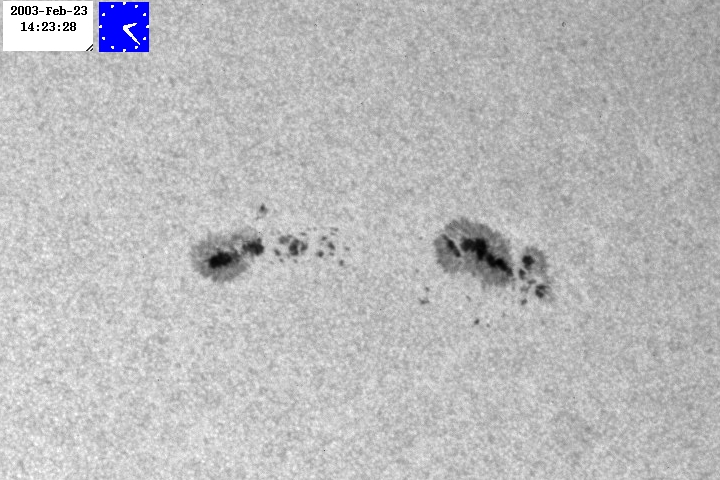 |
This 26MB QuickTime movie,
taken by TRACE with its White-Light channel, shows the emergence of
an active region starting just after its first appearance, and the
subsequent formation and evolution of a cluster of pores and spots.
The images span a period of 7 days, from 2003/02/19 to 2003/02/26.
|
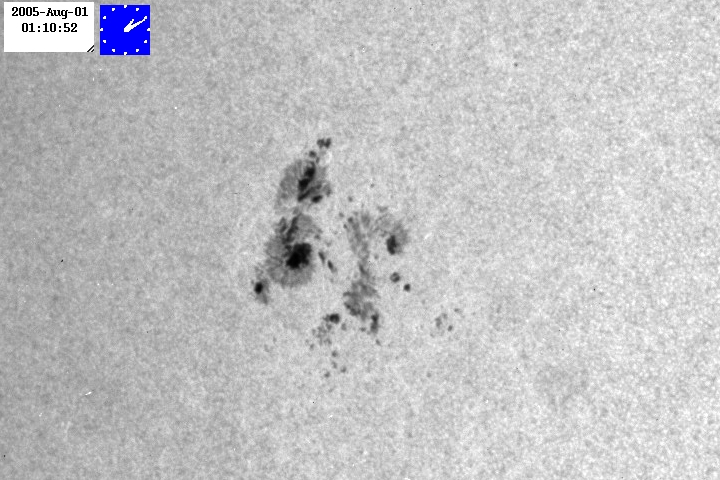 |
This 38MB QuickTime movie,
taken by TRACE with its White-Light channel, shows a spot plus
penumbral cluster in which some spot fragments and pores cluster to form
one larger remaining spot, with the ensemble of leading pores vanishing
over time.
The images span a period of 9 days, from 2005/07/30 to 2005/08/07.
|
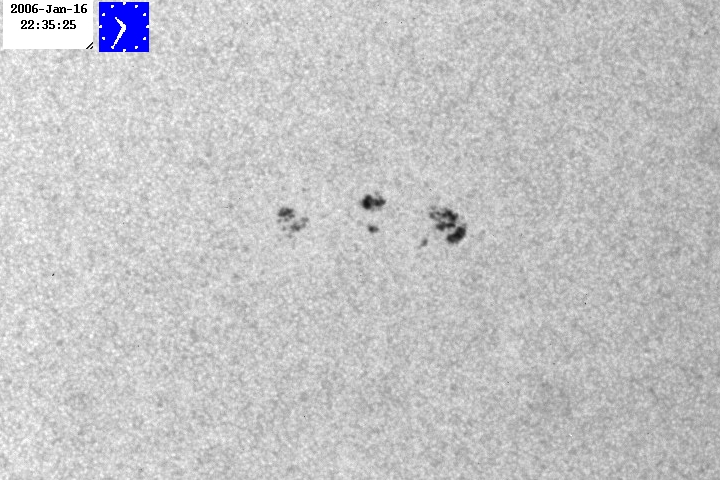 |
This 26MB QuickTime movie,
taken by TRACE with its White-Light channel, shows a small active
region emerging and pore clusters form large pores, some of which
vanish again.
The images span a period of 5 days, from 2006/01/14 to 2001/01/18.
|
|
.
|
|
| Home | Mission | Instrument | Team | Operations | Results | Images | Movies | Education | Site Info. | |