

The TRACE images may be used without restrictions
in publications of any kind. We
appreciate an acknowledgement indicating that
the Transition Region and Coronal Explorer, TRACE,
is a mission of the Stanford-Lockheed Institute for Space
Research, and part of the NASA Small Explorer program. More information on
TRACE and other TRACE images can be found
here.
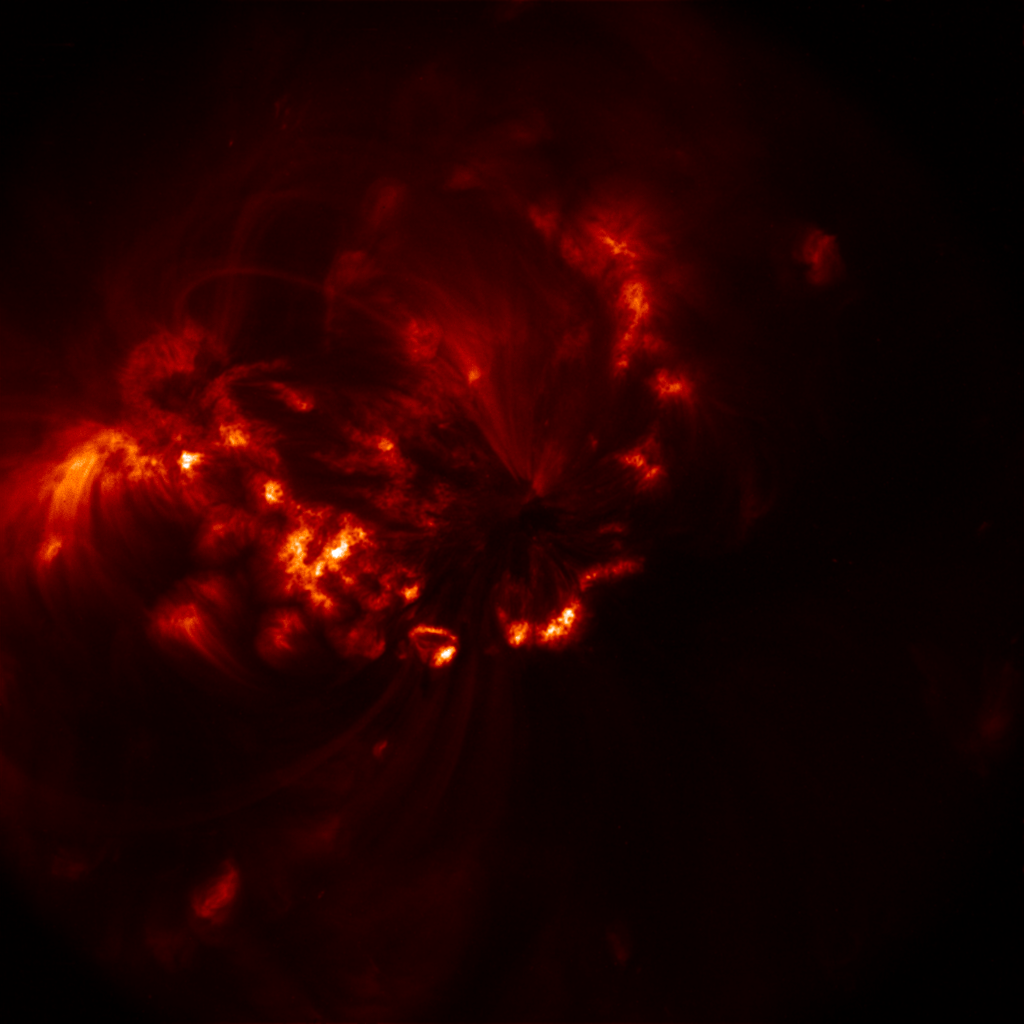 |
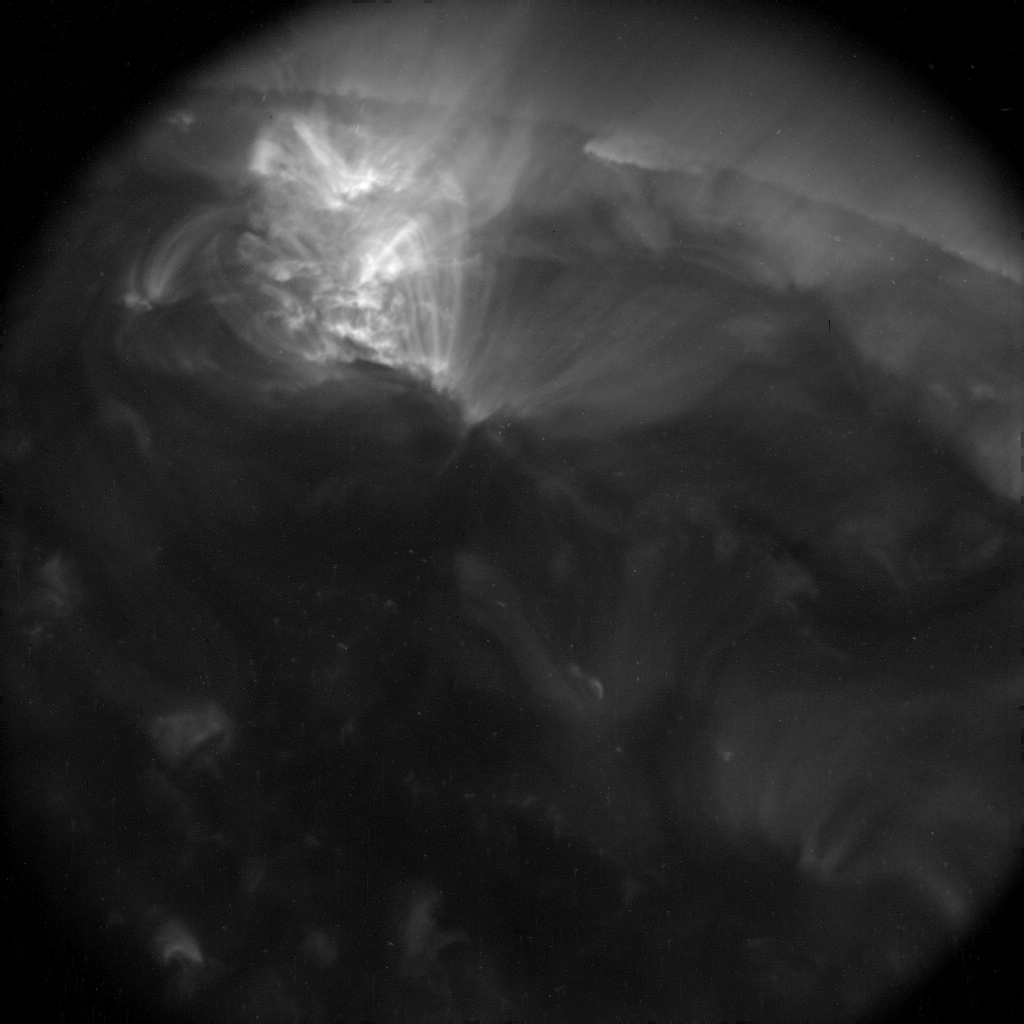
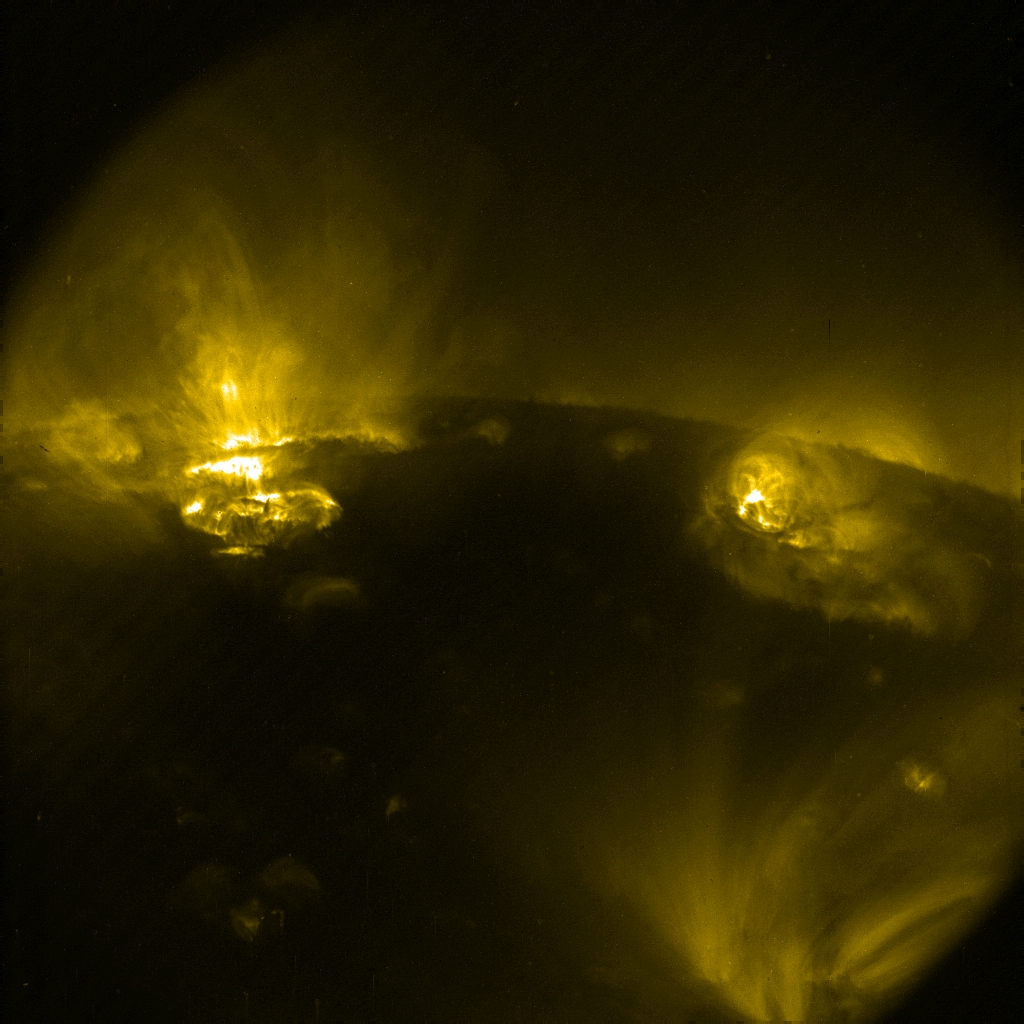
In this TRACE image of an active region taken on November 14, 2006 at
03:12:42 UT, snowflake-like dustings surround ephemeral gossamer
threads of plasma snaking along magnetic field lines. Though the solar
plasma itself emits photons across the electromagnetic spectrum, this
image captures photons emitted predominately by iron ions. The
photons, which have wavelengths of 192.03Å, 193.52Å and
195.12Å, reveal the structure of the magnetic field the solar corona
where temperatures can reach up to several million degrees.
(Courtesy Monica Bobra, SAO)
|
 |
What TRACE observed: a visual target synopsis for the 171Å channelLooking for observations of active-region disk crossings, filaments on the limb, quiet Sun, the north pole, or coronal holes with TRACE? We have multiple summaries of observations on line [links below], but we now add a visual summary of the entire mission (periodically updated to the present): We have prepared a series of visual summaries of TRACE observations from the start of the mission to the present in the form of a series of movies. Each movie shows approximately half a year of observations, summarized in 24 frames per day (or less, depending on how many were obtained), sampled uniformly from all available 171Å images. The frames are shown on the position of the solar disk where TRACE was pointing at the time; they fade away with an e-folding time scale of approximately 2 days. The date and time of the observation are shown at the bottom of each frame. The TRACE images used in these summaries are the so-called 'dosimeter images': virtually every TRACE EUV exposure ever taken was compressed onboard into a 128x128 pixel image for the entire field of view, regardless of any cutouts or resolutions chosen for the primary scientific images that were sent to the ground station. These dosimeter images are rescaled to have 1% of their area saturated on an otherwise linear gray scale starting at the readout pedestal of the CCD of 89DN; no other corrections were applied (note that many frames show radiation hits or data dropouts). Each of the movies is approximately 85MB to 115MB in size, and plays in 2.4 minutes at 30 frames/sec.
Other summary information on TRACE observations can be found at:
|
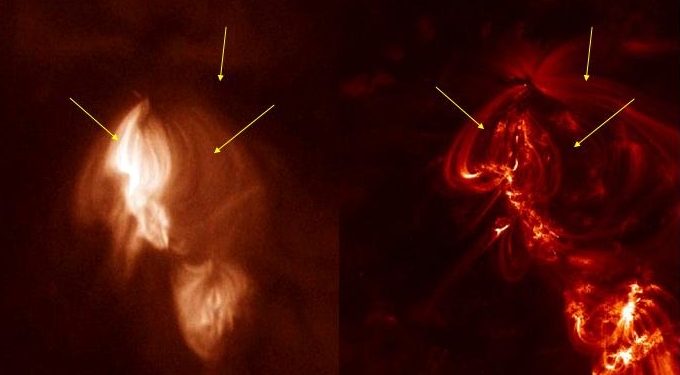 |
TRACE and Hinode/XRTThese two images were taken on Nov-1-2006 at 06:30UT. On the right is TRACE 171Å image, and on the left a Hinode/XRT Al/poly image. The active region in the field of view is a small unnumbered region in the southeastern quadrant of the otherwise quiet Sun. The arrows point to the same locations in the two images. Notice the complementarity of these two instruments: the XRT image (showing emission from plasma at about 2-4 million degrees) can be bright (dark) where TRACE (sensitive to emission from 1 million degree plasma) is dark (bright). Courtesy of Jonathan Cirtain (SAO). For more information on the Hinode/XRT, click here. |
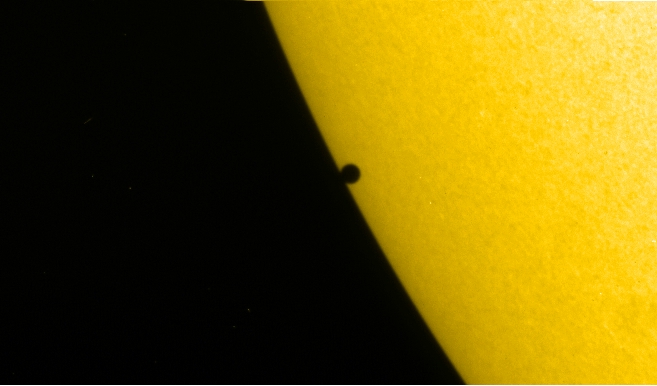 |
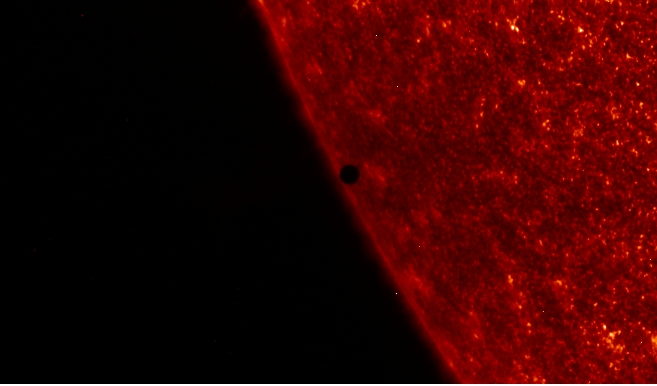
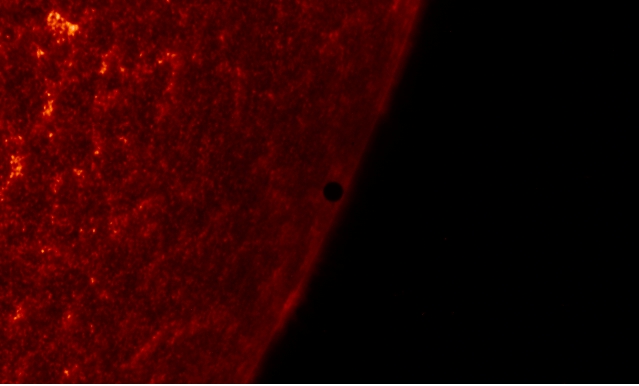
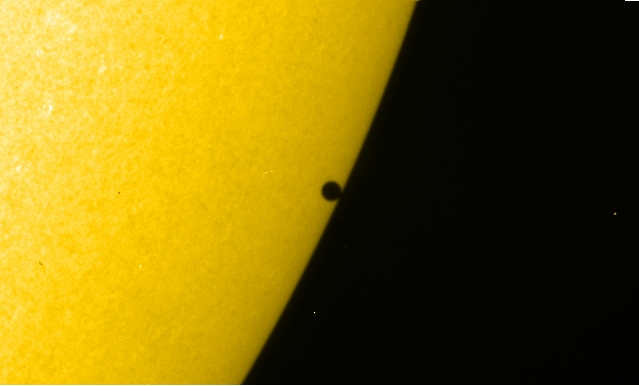
On November 8-9, 2006, Mercury transited in front of the Sun. The four images above show snapshots of the 2nd and 3rd contact. The first two, take at 19:13:01 UT in white light and 2 seconds earlier in 1600Å show the well-known phenomenon that the Sun has different diameters when observed at different wavelengths: although Mercury is moving from left to right, it appears well within the limb in the earlier 1600Å image while it touches the limb in the broad-band visible light channel. The same phenomenon is seen at 3rd contact in the last two images, taken at 00:08:41 UT in 1600Å and 00:08:31 UT in white light. The difference in the apparent radii is caused by a forest of dynamic spicules that glows in the UV 1600Å channel but is invisible in white light. That same forest of spicules is opaque to extreme ultraviolet radiation (and to X rays), as we saw in in 1999 in an earlier Mercury transit just over the solar north pole (see this composite image). A few movies of the TRACE observations of the 2006 Mercury transit can be found here. TRACE observed this phenomenon (which happens about 13 times in a century) twice before, in 1999 and 2003 (more images of the Mercury transits can be found among those of the 2004 Venus transit). The next Mercury transit is not until 2016 (on May 9) - while waiting for that, you could enjoy the Venus transit in 2012 (on June 6). The image to the left shows the transit as seen from Earth; see
Fred Espenak's NASA website on the
2006
Mercury transit.
|
 |
Active Region AR10917 emerged through the decaying remnants of
AR10910. Although solar activity had remained low after it's
emergence, the active region formed many beautiful loops as can be
seen in the TRACE 195Å image taken on October 27, 2006, at 02:22
UT. When this active region rotated off the solar disk, the GOES
X-ray flux decreased by an order of magnitude to a very low 'A' level
in the 1-8Å channel, leaving the solar disk in a very quiet
state, spotted only with a multitude of small X-ray bright points.
Courtesy Trish Jibben (SAO)
|
 |
On September 21, 2006, TRACE observed AR 10910 go through some dramatic
changes. The active region had several filaments associated with it and they
can clearly be seen as absorption features in the 171Å channel. The
11-h movie
shows two interesting phenomena. Beginning at 08 UT loops can
be seen to activate sequentially just south of the active region. Later, a
flare produced flows parallel to a highly shea,'*'red filament channel. There
are many more interesting flows and loop evolution that occur throughout
this movie and throughout the week as TRACE observed this small active
region.
Courtesy Trish Jibben (SAO).
|
 |
Active Region 10910 had a humble beginning as it rotated
into the Earth�s view. A mere
ephemeral region, one could hardly anticipate the number of events that
would eventually lead to its demise. However, AR10910 had a magnetic
topology ideal for reconnection. It produced several A and B class flares
throughout the week as small pores bobbed in and out of existence around the
main spot. TRACE observed this region in white light, the ultraviolet
1600Å channel,
and the 171&ARing; coronal channel as the
active region crossed the solar disk. This movie shows the region's evolution in the white-light channel over a 48h period. The slight wobble is caused by a deformation in the telescope's structure caused by the changing Earth-shine, and hence telescope temperature, as TRACE orbits the Earth every 96 min. Courtesy Trish Jibben (SAO).
|
 |
Looking through the solar atmosphereThe Sun consists entirely out of gaseous materials, consisting primarily of hydrogen and helium, mixed with trace amounts of many other elements including, among many others, iron. These gases are opaque from the solar surface down, but above the surface, the gas is so thin that we can look through the entire atmosphere.The surface temperature of the Sun is about 5700 Kelvin, causing it to glow white; within the generally bright glow, large clusters of strong magnetic field cause dark regions, known as sunspots, while small clusters cause a faint brightening, called faculae. The lower two images in the stackplot show a magnetic map (with magnetic polarities in different colors), and a white-light image, observed with the Michelson Doppler Imager onboard the ESA/NASA SOHO satellite, taken on 2 August 1999. Above the surface, the temperature rapidly increases up to several million degrees. This cause most elements to lose all their electrons, forming an electrically conducting gas called a plasma. The few elements that still have electrons at these high temperatures glow brightly in at X-ray and extreme ultraviolet wavelengths. Different colors of the light can be used to observe different temperatures, all mixed in an intricate pattern set somehow by the Sun's magnetic field. The four top images in the stack diagram show, from the top down, 3-4 million degree gas observed by the Japanese soft X-ray telescope onboard YOHKOH, and the 2, 1.5, and 1 million degree gases observed by the NASA small explorer TRACE. Click
here for a
JAVAscript movie that shows the larger, colorized versions of these
images in sequence.
|
 |
In this TRACE 171Å image of the eastern solar limb, one million
degree plasma cascades down clam-shaped loops long enough to wrap
around the Earth four times. The loops extend several thousand kilometers
deeper through the Sun's chromosphere, before they reach the
surface where they are anchored to regions of strong magnetic
field called sunspots. The image was taken at 03:08 UT on August 23,
and is shown rotated by 90 degrees clockwise. Courtesy Monica Bobra
(SAO). |
 |
As the Sun approaches sunspot minimum, active region become rare as
the wings of the butterfly pattern approach the equator. This image
(rotated counterclockwise by 90 degrees) shows active regions 10901
and 10902 (in TRACE's 195Å channel, most sensitive to emission
from 1.5 million-degree gases) on either side of the solar
equator (running up-down through the center).
Courtesy Dawn Myers (GSFC).
|
|
| Home | Mission | Instrument | Team | Operations | Results | Images | Movies | Education | Site Info. | |