

The TRACE images may be used without restrictions
in publications of any kind. We
appreciate an acknowledgement indicating that
the Transition Region and Coronal Explorer, TRACE,
is a mission of the Stanford-Lockheed Institute for Space
Research, and part of the NASA Small Explorer program. More information on
TRACE and other TRACE images can be found
here.
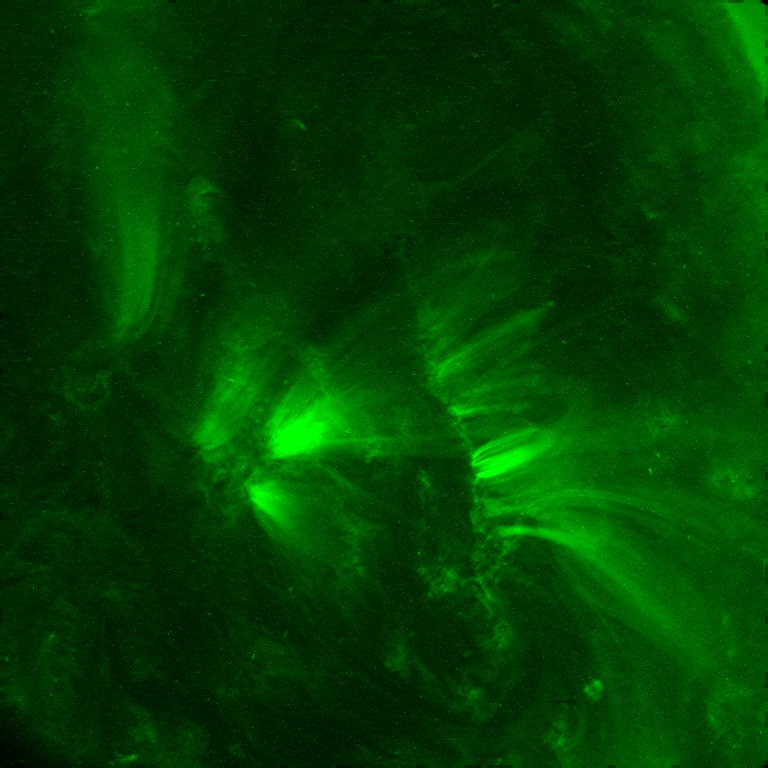 |
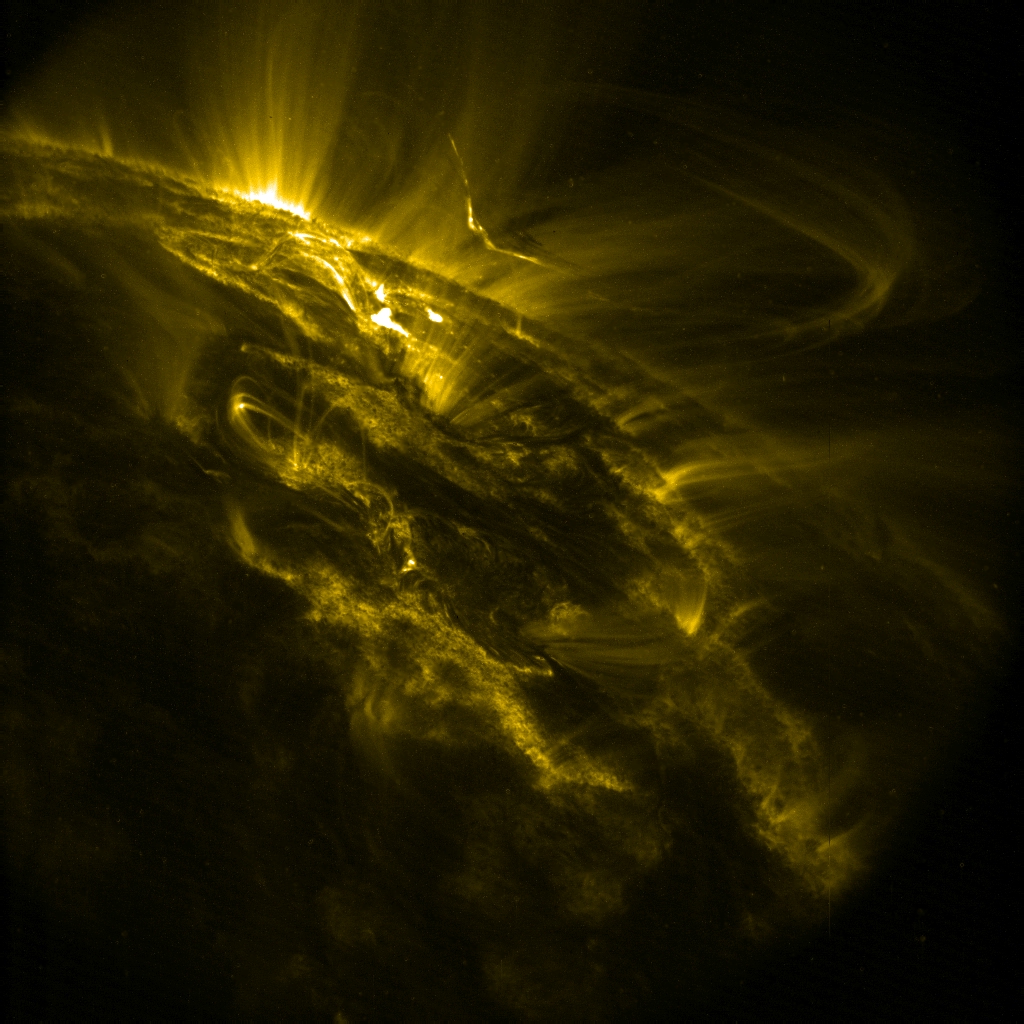
In its near-minimum state, the Sun only occasionally shows an
active region, like this one, AR10949, observed by TRACE
in its 171&ARing; channel. But even that region is small and
tired, with two faint ridges of magnetic flux with tufts of coronal
emission over them, and a filament riding between them. This region
did not even generate flares at the A level, leaving the X-ray emission
a few hundred thousand times below the peak during the
brighest
flare observed by TRACE .
Image courtesy of Kelly Korreck (SAO).
|
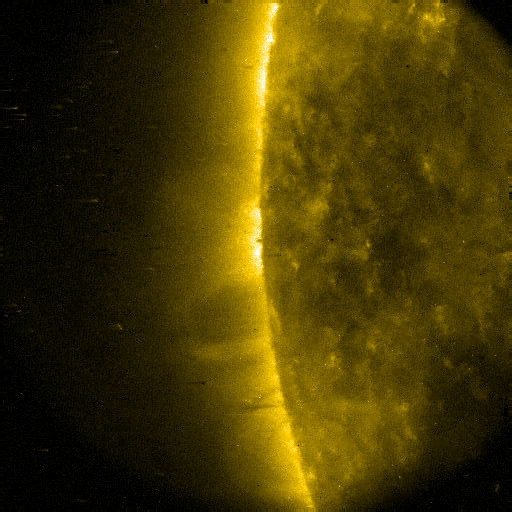 |
On 19 March 2007, TRACE observed two eclipses (not visible from Earth). Images of the 2nd event are shown here (images taken in the 171Å channel between 02:49:35 and 02:51:58. The Moon appears to move rapidly from left to right, which is a consequence of parallax as TRACE moves in its orbit across the Earth's polar region in the opposite direction. These images were obtained using only 12s exposures, 2x2 summed on readout from the CCD, and still the edge of the Moon is blurred substantially by its apparent motion during these exposures. For observations of other eclipses or planetary transits, click
here.
|
 |
On 2007/03/02 TRACE observed a filament eruption in Active Region 10944.
This event, associated with a mere B2 class flare, initially shows
the motion of a brightening hot loop wrapped around the filament,
quickly followed by the brightening of multiple distant flare ribbons
as the filament turns counterclockwise, as shown in
this (22MB)quicktime movie.
Notice how the nearby cool loop fans from the leading sunspot do not
change their shape at all during this event: the confined filament
eruption is, it would seem, an altogether local rearrangement of the
magnetic field. Event pointed out by Kathy Reeves (SAO).
|
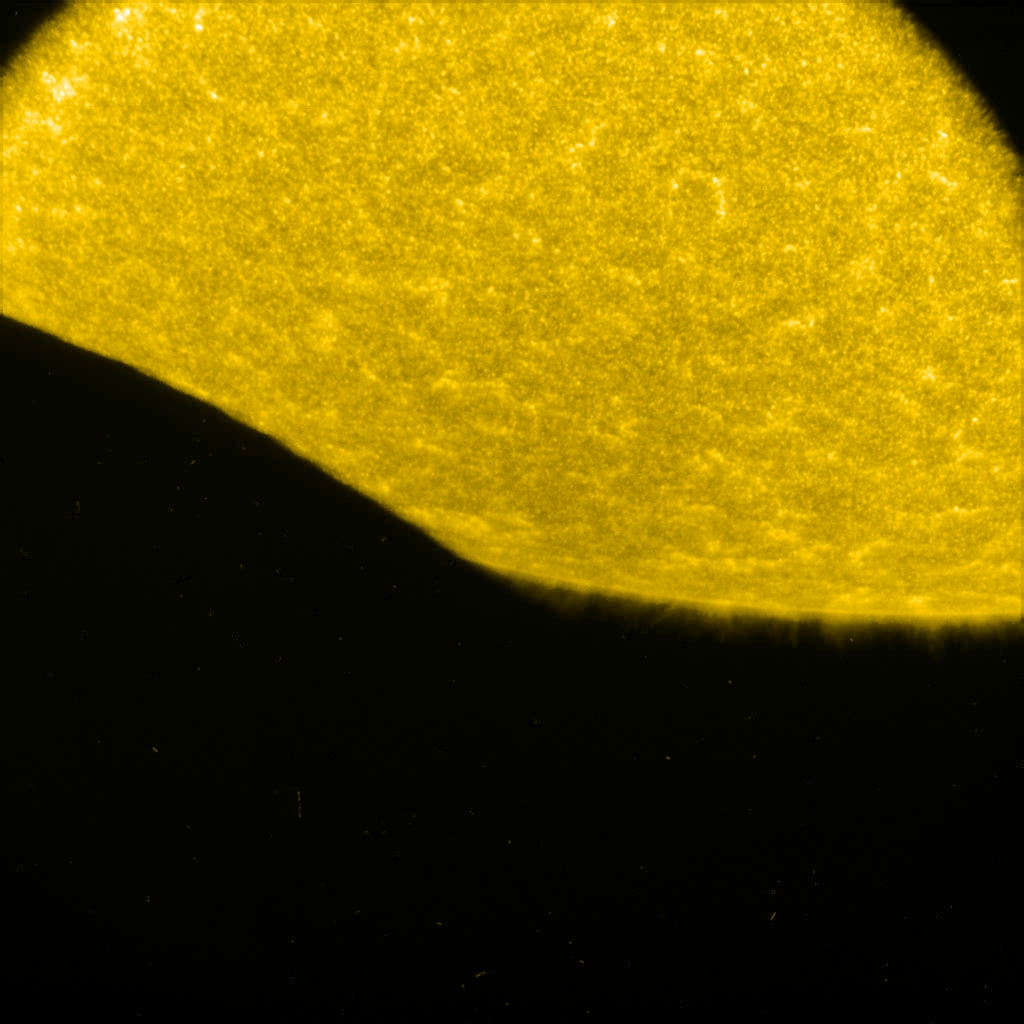 |
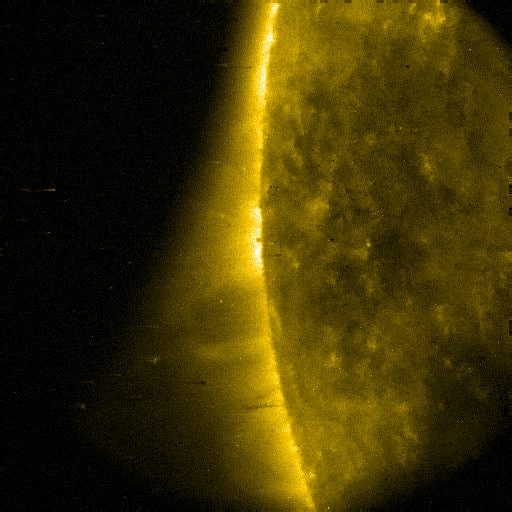
TRACE observed its fifth solar eclipse on 2007/02/17 as the Moon passed
across the southern solar limb. This
(1.4MB) QuickTime movie
shows a series of 1600Å images from 16:51UT through 16:56UT (shown
at half size; a full-sized image, taken at 16:55:25UT, can be viewed
by clicking on the image to the left). [A white-light (5.5MB) QuickTime movie, made by David McKenzie (MSU), can be accessed here] Other TRACE eclipse images:
Eclipse 2000/04/04, Eclipse 2001/06/21, Eclipse 2003/05/31, and Eclipse 2004/09/24.
|
 |
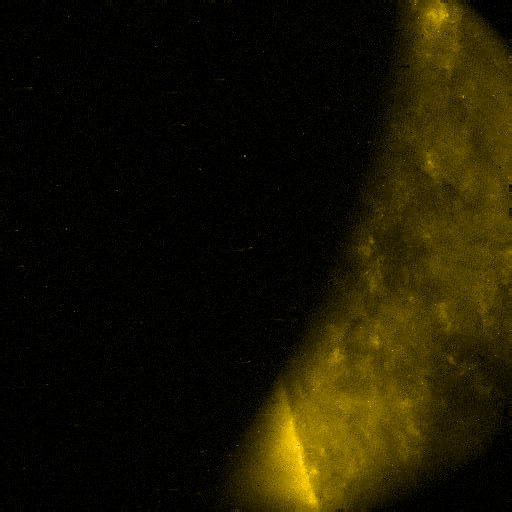
TRACE observed Active Region 10941 as it approached the Sun's western
limb (the images have been rotoated 90 degrees counterclockwise). This
(12MB) QuickTime movie
was made by selecting one image roughly every 3h, starting on 2007/02/04 at
08:08UT, and ending on 20070208 at 21:07UT. Playing this movie back and forth
gives the viewer a sensation of depth: even though individual coronal loops
evolve on a time scale of hours, the patterns formed by emitting loops
in this 4.5 day movie is stable enough to be able to grasp many aspects
of the 3-dimensional structure of the coronal field. For example,
the fuzzy patches that form an sweeping arc near the lower edge of the
images, can be seen to connect to the magnetic field near the center of
the field of view. Images courtesy of Antonia Sevcheva (SAO).
|
 |
Flare/filament (re)connectionOn 2001/09/30 TRACE observed an M1.0 flare in Active Region 9628 very near to the solar limb. This 90-minute (20MB) QuickTime movie shows the evolution around the time of the X-ray flare onset (at 11:31 UT according to the GOES X-ray monitor). Prior to the flare, we see a fragments of a prominence hovering above the regions, with filamentary dark (relatively cool) material moving along the field lines (and, perhaps, connecting down to the surface near the region). Then, around 11:30UT, a cusp-like brightening forms at the bottom edge of the prominence. This spreads to form the dragon-like bright outline (see the image to the left, taken at 11:34UT), as the M1.0 flare below brightens (including the two bright diffraction patterns seen in the 11:34UT image). In the next few minutes, the prominence material reveals clear connections to hot, bright loops in the distance on both sides, as if the material sits in a dip in the field. Then, around 11:43UT, the post-flare loops become visible in the TRACE images, connecting the spots where the diffraction patterns were centered a few minutes before. |
 |
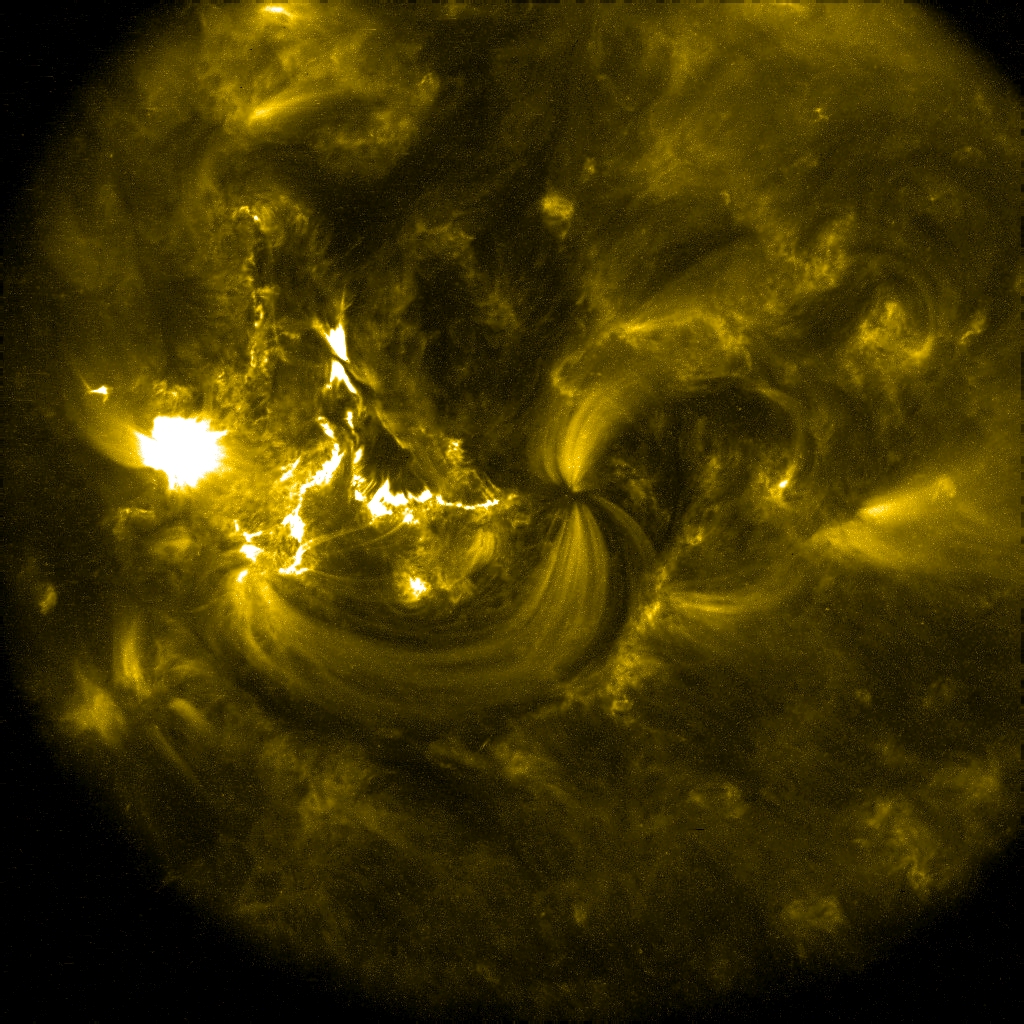
This TRACE 171Å image (rotate by 90 degrees clockwise) shows
Active Regions 10938 (at the limb) and 10939 (trailing) as they approach
the Sun's western limb. The smaller trailing region shows pattern of
relatively cool (1 million Kelvin) loops, brighest in those inclided
towards the horizontal, like a butterfly with open wings. The larger,
leading region has a rather different appearance, although it too is
magnetically relatively simple.
|
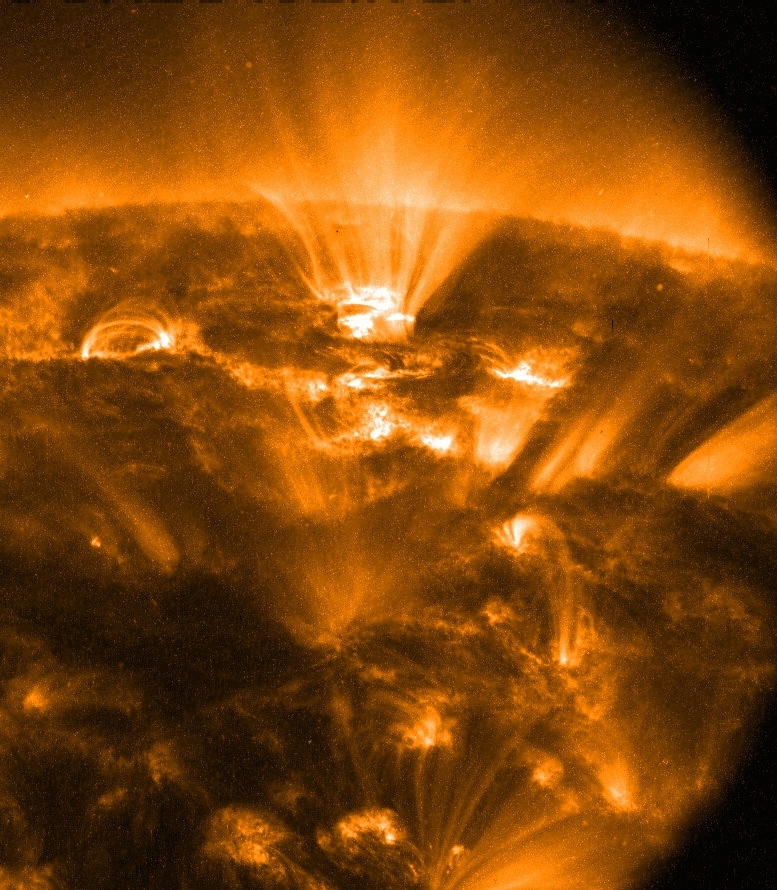 |
As active region AR10933 rotates off the solar disk on 2007/01/10 at 22:12 UT,
it shows a fan of high-reaching loops that stick out above the solar limb
in this TRACE 171Å image (rotated by 90 degrees clockwise).
Not only the main active region itself shows
such loops, however; they show up in the surroundings also, both in another
trailing region and over the strong magnetic network between the regions.
Some of the field in and surrounding these fan-like structures can
reach out far into the heliosphere as can be see in
this comparison of a full-Sun SOHO/EIT 171Å image with model
field lines overlaid. The field lines shown in this image are those that
reach into the plane of the planets according to our
solar-weather model (with black
and white lines for the two opposite polarities). The reasons why the cool
loop fans light up in the TRACE 171Å image, and their possible
relationship to the field that connects to the far heliosphere remain
topics of much scientic study. Image courtesy of Dawn Myers (GSFC)
|
 |
Around the time of solar minimum there are but few active regions, and
thus few major solar flares. Active Region 10930 was therefore a rare
treat: it produced multiple X-class flares as new magnetic field emerged
into an existing configuration. This
(32MB) QuickTime movie
shows the evolution of the complex spot group, surrounded by many
small dark pores and bright magnetic faculae, as observed by TRACE
over a 12-day interval, from 2006 December 06 04:24 UT
through December 19, 11:22 UT. Even in this series of white-light
images, the major flares show up as they faintly outshine even the
bright solar surface: see the images of two of the X-class flares
at 2006/12/06 19:05:19 UT and 2006/12/14 22:10:08 UT (the latter is shown
to the left, in a 360x240 pixel cutout from the full TRACE images).
|
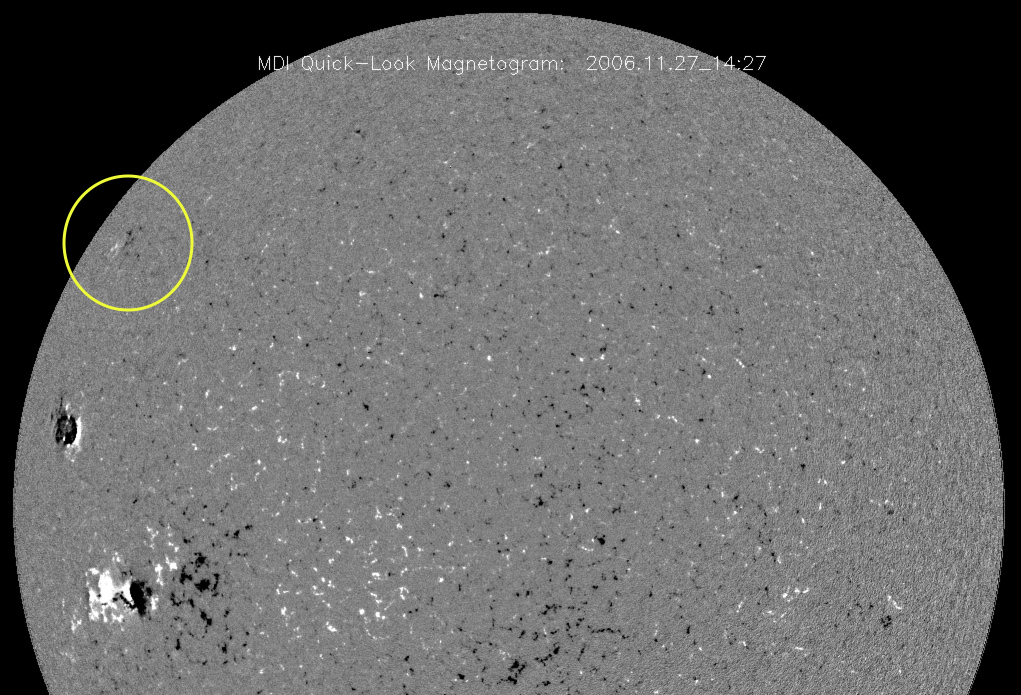 |
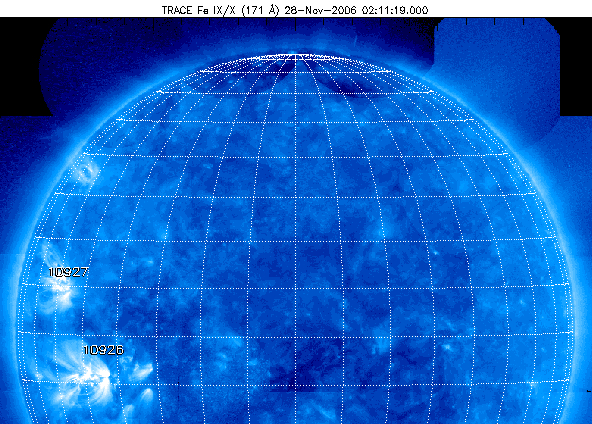
Beginning of the new sunspot cycle?TRACE observed a small, unnumbered active region in this full-disk mosaic taken on 2006/11/28; it is circled in the SOHO/MDI magnetogram below it. As unassuming as the region appears, it may actually be somewhat auspicious. Its relatively high latitude (north 35 degrees on the solar disk) is uncharacteristic for active regions or sunspots at the end of a solar activity cycle--all the other activity at this time is much nearer the Sun's equator. Full-disk magnetograms from SOHO MDI faintly show a concentration of magnetic field at this same location (circled), with polarity opposite that of the other north-hemisphere sunspot--in the image, the high-latitude region has negative (black) magnetic field in its west and positive (white) field in its east. In fact, the polarity of this high-latitude region is opposite that of all other north-hemisphere regions during this sunspot cycle, and is more like the polarity of south-hemisphere active regions. High latitude and reversed polarity are characteristics shared by sunspots and active regions of a new sunspot cycle. It's not uncommon to have a mixture of old-cycle and new-cycle regions on the Sun simultaneously, during the "overlap" period when the old cycle is finishing and the new is beginning. But the question is always, 'Has the new cycle actually begun?' This high-latitude active region, which has not yet been given an official NOAA number, may be suggesting an answer. Courtesy David McKenzie (MSU).
|
|
| Home | Mission | Instrument | Team | Operations | Results | Images | Movies | Education | Site Info. | |