Data are shown in Table 5 and graphed in Fig. 8.
| Order# | +45 | +135 | -135 | -45 | Average Separation |
| 1 | 0 | 0 | 0 | 0 | 0 |
| 2 | 1.36 | 0 | 0.75 | 0 | 1.05 |
| 3 | 3.20 | 1.41 | 2.15 | 0 | 2.25 |
| 4 | 3.58 | 2.15 | 4.22 | 1.41 | 2.84 |
| 5 | 2.82 | 2.82 | 4.39 | 0.67 | 2.68 |
| 6 | 4.27 | 3.56 | 3.46 | 2.20 | 3.37 |
| 7 | 4.90 | 4.27 | 4.97 | 2.44 | 4.15 |
| 8 | - | - | - | - | - |
| 9 | - | - | - | - | - |
| 10 | - | - | - | - | - |
| 11 | 3.61 | 3.91 | - | 5.10 | 4.2 |
| 12 | 4.24 | 4.24 | 3.61 | 3.54 | 3.9 |
| 13 | 5.00 | 4.24 | 5.00 | 5.66 | 5.0 |
| 14 | 4.24 | 5.67 | 6.40 | 5.66 | 5.5 |
| 15 | 5.66 | 5.32 | 5.85 | 5.66 | 5.6 |
| 16 | - | - | 6.40 | 6.40 | 6.4 |
| 17 | - | - | - | - | - |
| 18 | - | - | - | - | - |
| 19 | - | - | - | - | - |
| 20 | - | - | - | - | - |
| 21 | - | - | 8.49 | 7.81 | 8.15 |
| 22 | - | - | 9.22 | 8.90 | 9.1 |
| 23 | - | - | 9.22 | 9.22 | 9.2 |
| 24 | - | - | 10.63 | - | 10.6 |
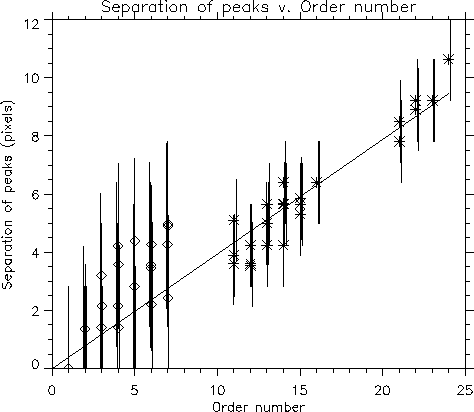 |
In analyzing the graph in Fig. 8, we must remember that orders before #10 are measured differently from those after #10. In the method used for higher orders, where there were distinctly separate peaks, there is a possible error of 1 pixel either way in the X and Y directions, because we assumed the peak was in the center of the pixel, when in fact it could be anywhere in the pixel. Thus, along the diagonal, there is a potential error of ![]() (=1.41) pixels.
(=1.41) pixels.
The method used to measure the smaller orders, where the image had not spread out enough to produce separate peaks, is much less accurate. It is difficult to say exactly where the image stops and the background begins because they fade into each other. Thus, it's harder to get an exact number for length and width. It's hard, too, to quantify the potential error, but we estimate that each measurement of length and width could be off by 1 pixel along the X and Y directions, or ![]() (=1.41) pixels along the diagonal, meaning that the total error for the separation is 2.83 pixels.
(=1.41) pixels along the diagonal, meaning that the total error for the separation is 2.83 pixels.
Taking error into account, a linear trend matches the data, and this line has exactly the slope calculated previously. Although most data points are higher than the line in orders 1-7, and many are below in orders 11-16, the line is well within the error bars; any differences can be accounted for by measurement error.