

The TRACE images may be used without restrictions
in publications of any kind. We
appreciate an acknowledgement indicating that
the Transition Region and Coronal Explorer, TRACE,
is a mission of the Stanford-Lockheed Institute for Space
Research, and part of the NASA Small Explorer program. More information on
TRACE and other TRACE images can be found
here.
 |
 TRACE observed this M1 flare on 14 September 2000 (not 1999 as the figure names say!) in its 171Å passband (most sensitive to emission from gas around 1 million degrees), which started to develop around 06:20UT. The frame on the left shows the bright, flaring loops only a quarter of an hour later (06:34UT). During the first hour and a half after the flare, nothing much spectacular happens: the post-flare loop system shows up, with brightening and dimming of cooling loops, gradually increasing with height. Another, smaller flare goes off towards the left (south in this image that was rotated clockwise over +90 degrees), but not much happens. Then, around 07:50UT, high loops brighten, but the spacecraft then goes through a radiation zone and stops observing. When it resumes observing at 08:11UT a tangled web of high loops shows up (the central image shows these at 08:13UT). Coronal rain streams out of them as cooling material falls back to the surface. The system seems to simplify dramatically, but it is unclear whether the field is reorganizing rapidly, or whether the simpler configuration of other field lines replaces that seen in the central image. Almost three hours after the main flare (with other, smaller flares still going off), a much simplified loop system continues to cool and drain (the image on the left was taken at 09:03UT). Did we see the field straighten itself out, or did we merely see the nesting of different sets of loops? Probably the former, but not until we see something like this again with much more advanced instruments will we know for sure. The field of view in the images is 115,000 by 155,000 km (shown with a magnification factor of two compared to most other images). |
 |
Image of the eastern limb of the Sun (rotated by 90 degrees) taken by
the Transition Region and Coronal Explorer on 3 December 1999, at
15:00:50 UT, in the 171-A passband that is most sensitive to
plasma at ~1 MK. The cutout shows an area of 310,000 by 270,000 km,
using a linear gray scale, slightly high-pass filtered, but otherwise
unprocessed. Most striking are the high-arching loops on the right
that form what appear to be cusps at their tops. Despite the
line-of-sight confusion, the strong curvature of the field lines near
the apparent cusp is suggestive of the existence of a current sheet
there. Below it, a filament is seen in absorption, together with all
the other features typical of active regions, including the low-lying
moss, chromospheric sprays and surges, and large-scale coronal loops.
|
 |
 The image on the left shows a filament eruption from Active Region 8948, observed on 16 April 2000 by the Transition Region and Coronal Explorer. The composite image on the right shows the eruption in progress at four different times, both in the 171Å passband (characteristic of emission from gas at about 1 million degrees) and in the 1600Å passband (a mixture of temperatures from a few thousand (solar surface) to just over 100,000 degrees (in the brightest parts of the filament). The filament begins to rise around 03:49UT, accelerating rapidly within a few minutes. Within 15 minutes the field has largely completed its reorganization, while material begins to cool and flow back towards the solar surface. Two hours after the start of the eruption, most of the material has drained down to the region below as well as to a distant region to the right. The field of view in the composite images is 153,000 by 195,000 km. Filament eruptions can be recurring phenomena: the
image above on the right was taken a day earlier, at 15:46UT, showing
a similar, but lower, activation of the same filament configuration.
|
 |
 On the left is an image of AR 9289 observed in January 4, 2001 at 01:26:57 UT. This image (in the 171 Angstrom passband; around 1 million degrees) shows a bright streak of material, that is being accelerated upward during a reorganization of the magnetic field that became apparent roughly half an hour earlier. The feature originates from the edge of the umbra of the underlying sunspot; it is visible both in the EUV and in the 1600Å UV channel, as shown in the image on the right (1600Å passband; 01:27:02UT; not precisely aligned). Apparently, there is material of a range of temperatures that spans at least a factor of ten (from 0.1 to 1 million degrees). Courtesy: Dawn Myers. |
 |
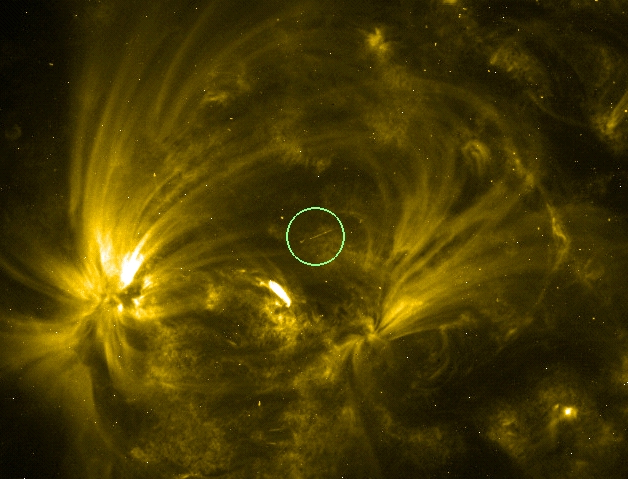
 Bright loop top emission observed with TRACE (171Å; 1 million degrees) is often the consequence of rapid loop cooling. These two images, taken on 18 November 2000 at 15:54UT and 16:11UT, respectively, show such an event: the red circle in the image to the left shows a region where many loops are cooling, with bright loop tops (the intensity scales with the square root of the image to reduce the dynamic range). Within 15 minutes, the loops cool so much that material has reached a temperature of less than 20,000 degrees, and it can be seen raining down back onto the solar surface, absorbing emission from lower-lying structures (such as in the white circle) as it passes over them. |
 |
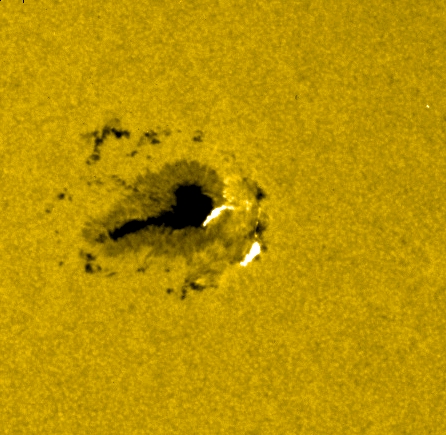
 Solar flares: X X X (M) M X M XAn unusual magnetic flux emergence in active region AR 9236 triggered a series of strong magnetic flares (see GOES X-ray plot in the third figure from the left; all but one of these strong flares occurred in AR 9236). A string of strong new spots emerged at the location of an existing large sunspot. The leftmost image shows the UV (TRACE/1600Å) image of the peak of the flare at 15:09:01 UT (saturating the camera in the brightest domains). The middle image is a white-light image, showing the large existing spot, a new string of small spots to the right, and two of the bright ribbons at the footpoints of the reorganizing magnetic field (15:08:38 UT). The associated sequence of impulsive reorganizations of the field caused a sequence of coronal mass ejections that were observed with SOHO/LASCO (1.5MB) (from the SOHO web pages). Two days later, the ejecta hit the Earth's magnetic field, causing a G1-2 class geomagnetic storm (see the rightmost image; from NOAA). |
 |
This is an image of AR 9201 taken on 26 October 2000, around 06:55 UT.
The image (171Å; ~1 million degrees) was taken
right before a small eruption in the upper field of view.
Courtesy Dawn Myers.
|
 |
This image in 171 Angstroms of Active Region 9212 was taken on November 1,
2000, around 10:15 UT. It shows a filament activation. A filament is a
magnetic configuration of predominantly horizontal, low-lying magnetic field,
containing material at a wide range of temperatures from close to 10,000
degrees (dark material, absorbing EUV light) to over a million (bright
in this pass band). This 2.5MB
AVI/Cinepak movie (10:09-10:55 UT)
shows the initial activation of the
filament, and the subsequent counterstreaming of material towards both
ends of the structure.
Courtesy Dawn Myers.
|
 |
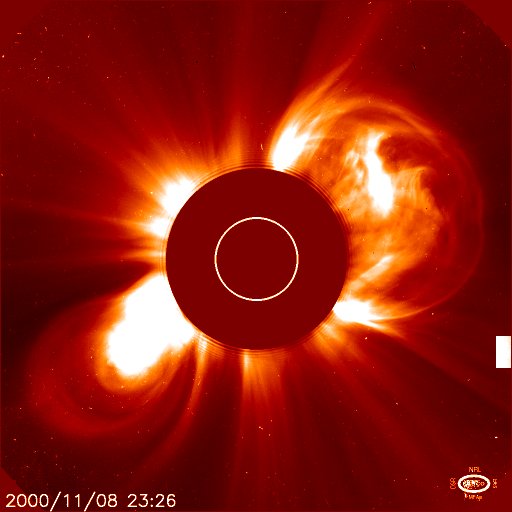
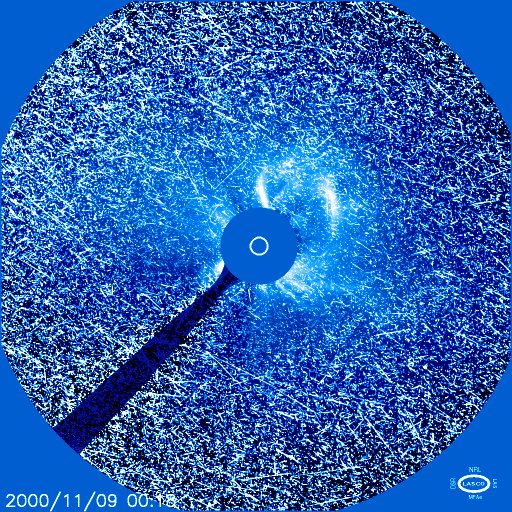
 On 8 November 2000, a not so spectacular M7.4 flare went off around 22:42 UT in AR 9213, fading again by 00:05 UT, near the west limb of the Sun (a half-size 2.6MB Quicktime/Cinepak movie of the initial flare event is shown here (~20:00 - 23:50 UT); note that the deformation of the high coronal field begins prior to the main flare and continues well into the flare; note also the flaring that goes on in the distant region at the solar limb that may well be related to the main event in the nearby region through some magnetic coupling). The leftmost image is a TRACE 171Å image (~1 million degrees) of the rapidly cooling, postflare loop system, rotated so that north is to the left (a half-size 4.4MB Quicktime/Cinepak movie covering six hours of the evolving cooling loops, showing the heavy showers of coronal rain as cooled material falls back to the surface, is shown here; 01:51-07:52UT). The flare was associated with a coronal mass ejection, observed by the LASCO instrument on SOHO (central two images). The flare caused a very strong spray of highly energetic particles, that showered the SOHO instruments (see the second image from the right for the effect of protons traversing the detector), and shortly afterwards reached the Earth. There, they populated the radiation belts with particles that were 100,000 times more frequent than the normal background density, slowly decaying with time. The CME associated with the event travelled towards the Earth at an average speed of 2000 km/sec, impacting on the Earth's magnetic field after only 31 hours, and sparking a strong (G3 class) geomagnetic storm (see GOES satellite data). |
 |
Even at the high angular and temporal
resolution of TRACE things happen that are
at or below what we can resolve. Often such small events happen so fast that
they escape notice unless the eye catches them. Moreover, on a single
image, such small processes can look a lot like dots and streaks caused by
highly-energetic particles traveling through the detector. In this composite
171Å image of AR9201, taken on 24 October 2000, around 13:42UT, one such event
is highlighted within the circle. The image is actually a blend of two
successive exporusure. The first image (at 13:41:56UT) shows a little
bright kernel seen on the left, while the second image (at 13:42:23UT)
shows a small streak. Only when seen together is it clear that the event
is really solar, and that a small explosion leads to a tiny jet. On the next
image, at 13:42:50UT) nothing can be seen of this event.
|
|
| Home | Mission | Instrument | Team | Operations | Results | Images | Movies | Education | Site Info. | |