

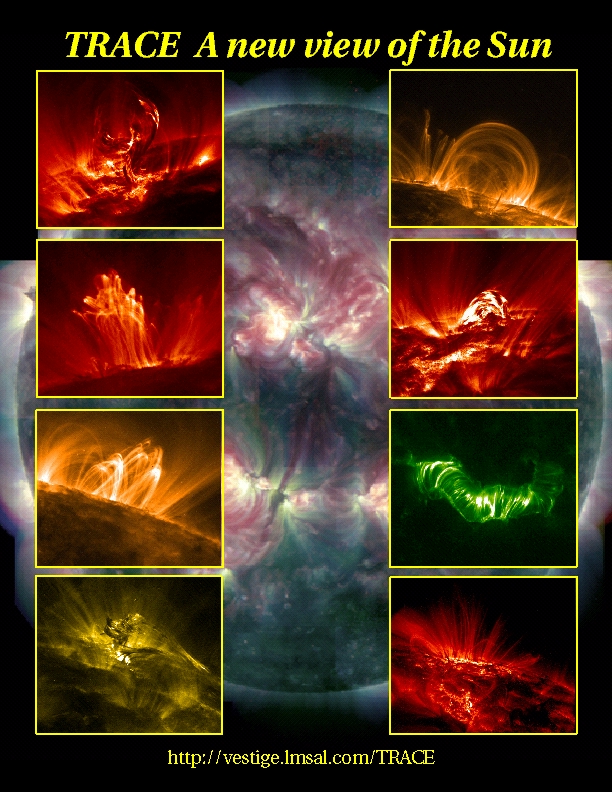
The TRACE images may be used without restrictions
in publications of any kind. We
appreciate an acknowledgement indicating that
the Transition Region and Coronal Explorer, TRACE,
is a mission of the Stanford-Lockheed Institute for Space
Research, and part of the NASA Small Explorer program. More information on
TRACE and other TRACE images can be found
here.
 |
Active Region 9433 has been generating a number of C and M flares as the region
grew in complexity. There have been two areas of strong shears,
one in the leading and one in the trailing area. Most of the flares
have been confined primarily to one or the another area. However, the
M3 flare at about 13 UT on 24 April 2001 shows a peak in both
simultaneously, suggesting that these two zones have now become coupled
magnetically. The X-like pattern of dots centered on each of the
bright Fe IX/X 171Å flares is a diffraction pattern from the very
bright kernels in the flares. Also note the thin ring of emission
surrounding the left (eastern) flare.
Courtesy: Dick Shine.
|
 |
This is an image taken on April 19 2001 at about 13:30 UT of Active Region
9433 (which is the second passage across the solar disk of what was
AR 9393 during the first passage; then it produced a
bunch of X-class flares). This image (rotated over 290 degrees)
is in the 171Å bandpass (1 million Kelvin) and shows
some post flare loops, cooling after an M2 flare that started two
hours prior to this image. Courtesy Dawn Myers.
|
 |
Easter Sunday: X14.4 flareTRACE also observed the Sun in the 1600Å channel, showing the intense radiation from the rapidly cooling loops above the solar surface, as shown in this (QuickTime; MotionJPEG/A compressed, Interlaced Odd; 11MB) 1600Å movie. This post-flare coronal rain shows the mixture of temperatures from some 10 million degrees to `only' some 100,000 degrees (a factor of 100!) in close proximity.
The TRACE movies show a lot of `noise' starting only minutes after the
flare as a result of highly energetic protons and electrons hitting the
detector, going right through the filters and even the spacecraft walls
around the camera. These particles, that are causing a hazard to
humans in space and can damage satellite electronics, also
cause the "snow shower" seen in the LASCO and EIT images shown on this
SOHO Hot Shot web page, and on the
GOES proton-flux plot which measures the proton density near Earth:
the high-energy proton level went up by a factor of about 1,000 shortly
after the flare.
|
 |
TRACE observed this small filament activation on 22 October 1999, in
its 171Å passband (1 million degrees), shown in this
(QuickTime; JPEG/A compressed; 0.7MB)
1-hr movie. The filament rises,
exhibits what looks like a ring of hot material on a pedestal
of cool and hot material wrapped around each other. The cool material
then falls back onto the surface (compare with
this event).
|
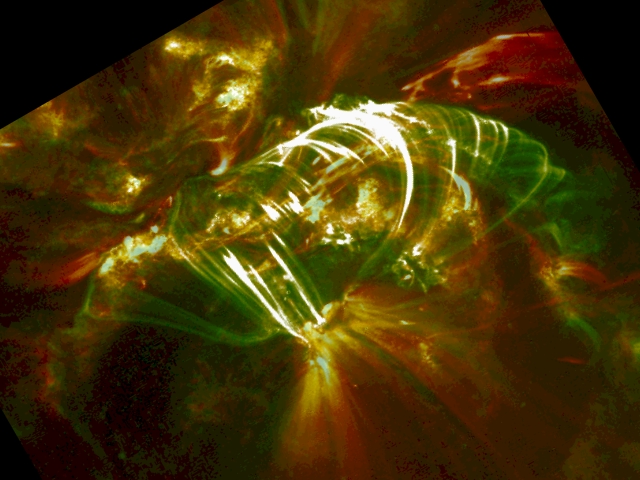 |
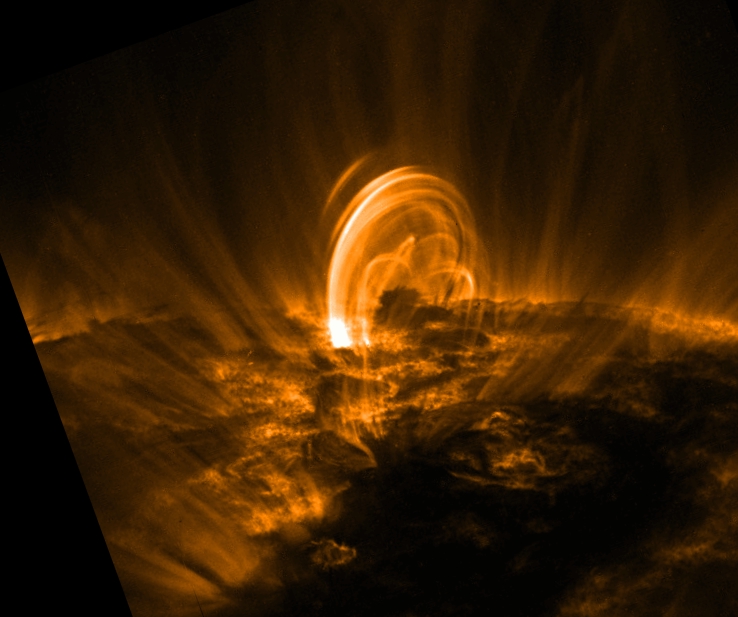
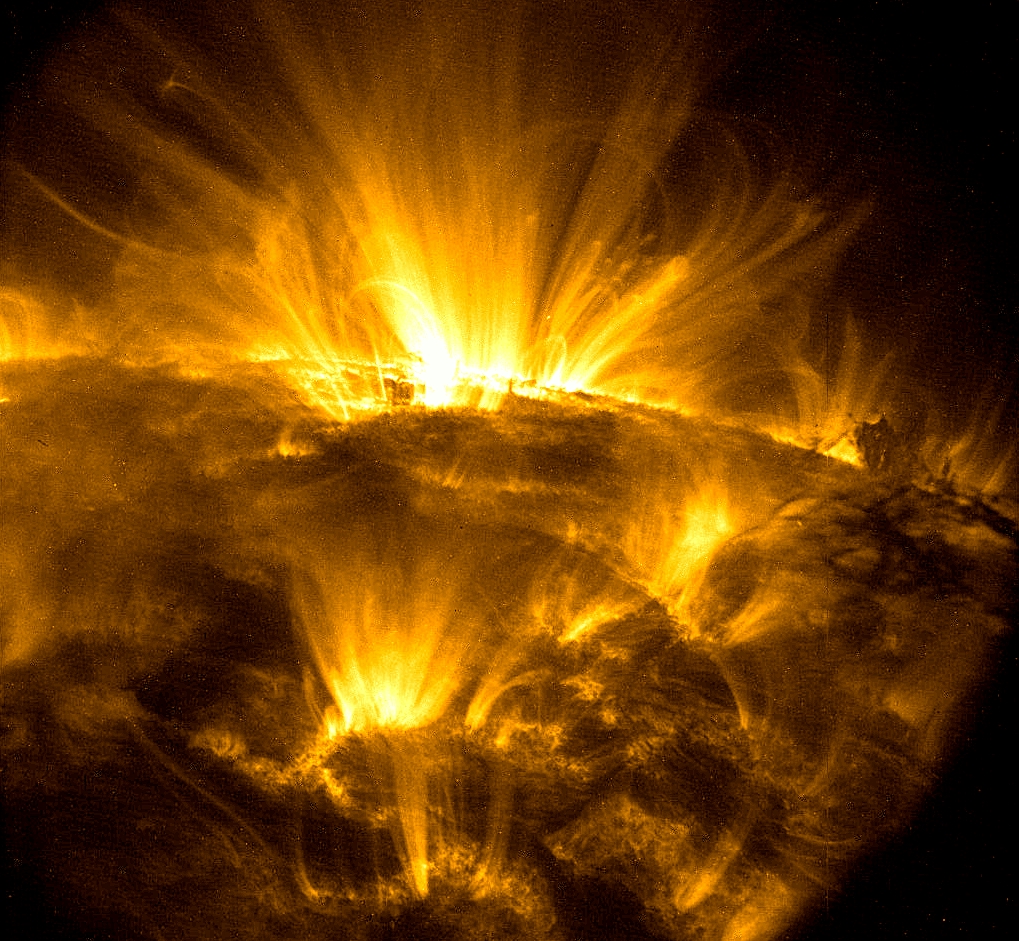
The top image shows Active Region 9415 on 10 April 2001 at 06:00 UT
in 171Å (characteristic of emission from gas at 1 million Kelvin).
The field of view is 232,000 by 174,000 km;
the image was rotated over +120 degrees.
These loops are the result of an X2.3 flare that started at 05:06 UT.
The flare showed a
classic double ribbon structure. As the ribbons spread apart with time the
post-flare arcade of cooling, draining loops was formed, expanding with time.
Courtesy: Dawn Myers. Click
here for movies (BIG files!) of this event (courtesy Sam Freeland).
The bottom image shows the difference between the pre-flare phase (at
05:05 UT) in red
and the post-flare cooling (at 08:38UT) in green; where the image is yellow,
the emission hasn't changed much.
|
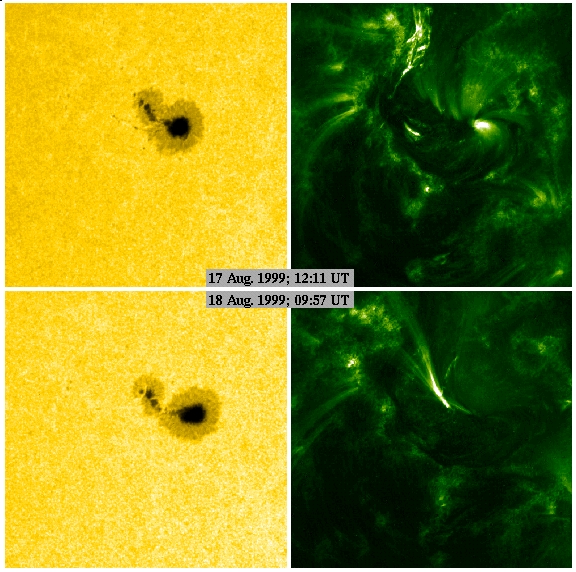 |
On 17 and 18 August 1999, TRACE observed a filament destabilization and
eruption in Active Region 8667, in the 195 Å passband (mostly
sensitive to emission from gas at 1.5 million Kelvin). The composite
image on the left shows two pairs of white-light (left) and 195 Å
(right) images, taken almost 22 hours apart. The spot shows little
evolution during the eruption, but the hot corona changes significantly.
This evolution can be seen in the (QuickTime; JPEG/A compressed; 6.6MB)
movie: First there is the flare
and eruption, with some brigh ``moss'' ribbons lighting up northward
of the main eruption, presumably showing the footpoints of hot loops or
even where accelerated particles impact on the lower, denser atmosphere.
After a data gap of one hour, high-arching cooling loops can be seen,
as well as a sharp, bright line of moss moving into the spot; behind that
front, loops are seen to cool into the range of temperatures visible in
this 195 Å image. Successive generations of cooling loops are
seen to move into the sunspot, and even into the darkest parts, the umbra.
|
 |
 1 April 2001: |
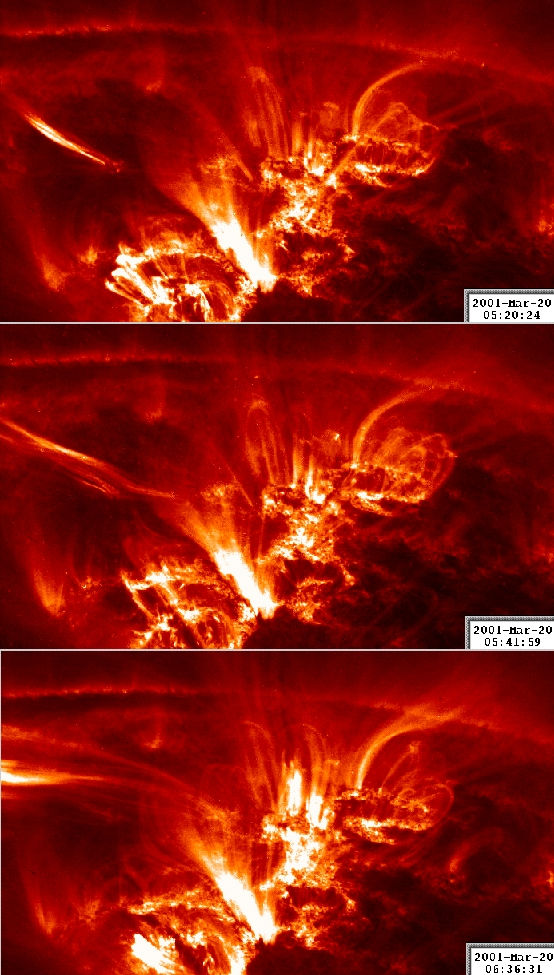 |
This triplet of images of Active
Region 9373 (rotated counterclockwise over 90 degrees), was taken by
TRACE in its 171 Å passband (sensitive mostly to emission from
gas around 1 million degrees) on 20 March 2001. It
shows evidence of a magnetic X point.
But it's an odd sequence, in which the magnetic configuration is
outlined by successive series of brightening loops. Look at
this image:
it outlines some of the coronal loops that are visible in one of the three
TRACE exposures, and it repeats them in each panel. The kinked line is
one that probably just misses the X point: coming from the left, it
approaches a magnetic charge, then senses that there is another, more
distant charge to connect to, and continues past the X point to
connect to that charge using a nearly horizontal path to get there.
This movie (1.5MB; QuickTime,
JPEG compressed) shows the evolution over a 3-hr period.
|
 |
TRACE observed the activation/eruption of a filament in Active Region 8631
on 20 October 1999, around 05:50UT. The image on the right, taken around
05:57UT, shows the filament in mid-eruption, with bright, hot material
(around 1.5 million degrees as seen in this 195Å image) and cool,
absorbing
material mixed in close proximity (the field of view is 640 by 480 pixels
of 0.5 arcsec (~380 km) each). The (QuickTime; JPEG/A compressed; 3.7MB)
movie shows the evolution of the
eruption, from 05:50UT through 06:25UT. Notice that as the dark, cool
filament material begins to rise, hot blobs form throughout and around
the structure. The filament reaches its highest elevation around 06:00UT,
after which the the field continues to reorganize itself, as material
begins to cool and fall back. Notice the post-eruption arcade forming
below the filament as the loops in question cool to temperatures for which
this TRACE passband is most sensitive, i.e. around 1.5 million Kelvin.
|
 |
Shaken again |
|
| Home | Mission | Instrument | Team | Operations | Results | Images | Movies | Education | Site Info. | |