

The TRACE images may be used without restrictions
in publications of any kind. We
appreciate an acknowledgement indicating that
the Transition Region and Coronal Explorer, TRACE,
is a mission of the Stanford-Lockheed Institute for Space
Research, and part of the NASA Small Explorer program. More information on
TRACE and other TRACE images can be found
here.
 |
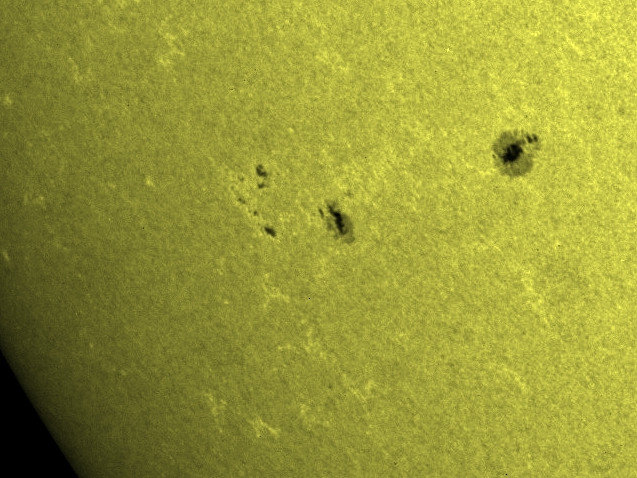
More on the birth of AR 9574.We have already shown the birth of Active Region 9574 here as seen in the corona (look here). This (QuickTime/JPEG; 27MB) movie shows another aspect of that emergence. It was taken in the 1600Å channel, which shows as small, bright patches the locations of strong magnetic field clumped into relatively small concentrations. These form the footpoints of the coronal arches seen by YOHKOH's SXT, SOHO's EIT, and TRACE. Larger concentrations form dark areas in the photosphere known as spots and pores. The movie covers six days in the evolution of AR 9574 at the northern edge of the field of view; it also shows the spots and magnetic plage of AR 9570 further to the south. This long movies also shows the evolution of the magnetic field concentrations caught in the large-scale convection called supergranulation: the network-like pattern of strings of bright points evolves on a time scale of about a day, as field is swept into the evolving downflow lanes. The faint flickering in the background is caused by sound waves that pervade the solar atmosphere. |
 |
Imaging and spectroscopy together provide us with very powerful tools to futher our understanding of the Sun's outer atmosphere. Here is an example, shown as a (Quicktime; 14MB) movie, which shows SOHO/SUMER spectra on the left, and TRACE 171Å images (characteristic of gas near 1 million degrees) on the right. The three panels on the left hand side of the movie are SOHO/SUMER spectra of three different ions that occur within the Sun's tenuous, hot outer layers; the Si II (16,000 degrees), C IV (100,000 degrees) and Ne VIII (800,000 degrees ) lines. The panel on the right hand side shows the Sun as seen through TRACE's 171Å filter. The vertical line moving across the TRACE images shows where the spectra were measured at any given time. The time given in the lower right hand corner is the time in seconds from the first SUMER image. At certain locations during the scan of the active region (observed on 13 May 1999), SUMER observes highly broadened and asymmetric C IV line profiles (for instance, around 1700 seconds and 2400 seconds). These events in the C IV line are typically associated with magnetic reconnection. Some of these reconnection events are also associated with changes in the TRACE images (for instance the appearance of the bright coronal loop after the event at 2400 seconds). Courtesy Amy Winebarger (SAO, Cambridge, Mass.).
|
 |
The birth of AR 9574.Starting on 9 August 2001, some time before 07 UT, a new active region began to emerge, later to be called AR 9574. The (QuickTime/JPEG; 8.4MB) (171Å) movie (of 640 by 480 pixels of 375 km each) shows this emergence almost from the start, covering a period of 4 days. Unfortunately, the emergence occurred at the edge of the TRACE field of view, so that we have full coverage only in what we call the context images; these are images covergin the full field of view, but taken at a much lower cadance than the 3/4 field cutouts that were being made every 20 seconds to study AR 9570 just south of the new region (visible at the lower edge of the movie).Until about 20 UT on 9 August the region is compact, and all coronal connections appear to close onto itself. But then new connections develop, first to the south, later also northward. Notice also that the fan of coronal loops emanating from the sunspot in
AR9570 in the south appears to be rotating, at least during the first
half of the movie.
|
 |
Spots and nests, coming and going.One of the major advantages of TRACE is that we can view the Sun without interruption for most of the year. And often we use that. This (Quicktime/JPEG; 16.5MB) movie is particularly interesting, because it shows two processes that have until now rarely been observed as completely as in this data set.The first is the demise of a large sunspot over a period of some ten days: the spot can be seen to shrink, fragment, evolve into pores without penumbrae, which themselves ultimately disappear without much of a trace. To the left of this decaying sunspot is an activity nest that spawns
three successive generations of large magnetically active regions,
plus a bunch of smaller ones in the immediate vicinity. The first large
emergence
begins on July 27; its first pores and spots become visible around
20 UT on that day. The dark concentrations of field are seen to separate
by polarity, each clustering
together, just the way they are supposed to. Then, between
21:30 UT on July 30 and 04 UT on July 31 (during a gap in our data
stream, of course) a new bipolar regions begins to emerge. The spots
in these regions decrease in size and fade away. Then the third
generation of active regions in the nest begins to emerge early on August 3.
A day and a half later, a major, complex sunspot group has formed.
|
 |
The image, taken by TRACE on 9 February 1999,
shows high-arching loops connecting two active
region complexes across the equator. This
composite of nine exposures (171Å, 195Å, and 284Å at
three pointings)
shows relatively cool plasma in red and warm plasma in pink.
The images of the eastern limb of the Sun
are shown binned to 1 arcsec pixels.
|
 |
 On 20 July 1999, TRACE observed a small eruption within an active region. The lefthand image (taken at 00:46UT) shows the 1 million degree gas as observed in the 171Å passband. The image on the right is the corresponding magnetic map, as observed by MDI on SOHO (taken at 23:59UT on the preceding day; opposite polarities are shown as green/blue/white and orange/red/black as strength increases); the alignment is correct to within 2 pixels. The images show a field of view that is 190,000 km to a side. A small coronal brightening develops around 00:31UT in the polarity-inversion area near ``A'' (see the label in the large version of the righthand image). Around 00:38UT material is ejected nearly horizontally towards the upper-right as well as to the lower-left in a bidirectional ``jet.'' The material that is ejected southward travels trough the polarity inversion zone ``B,'' typically dark in the coronal 171Å emission, and fades away as it begins to curve back towards the sunspots at ``C.'' Yet around 00:45UT some faint brightenings near ``C'' show material reached that point, traveling at an average (projected) speed of over 200 km/sec. |
 |
On 15 April 2001, a relatively small filament in Active Region 9415
began to erupt around 22 UT, shown in this (QuickTime/JPEG-A; 2.5MB)
movie.
Within about 10 minutes, the material
(seen here in the 171Å pass band, most sensitive to emission
from gas at around 1 million Kelvin)
reached up to a height of approximately 80,000 km. The magnetic field
within the filament continues to writhe and twist for a while longer,
but most of the material begins to fall down again. The filament
eruption (not high and strong enough to make it into a true coronal
mass ejection) also excites loop oscillations. The loops in the
arcade that arch over the filament initially are forced to bend away
from the site of the eruption. Apparently that happens quickly enough
to start an oscillation that travels through the arcade as in a
harmonica. As in all previous cases (we have now seen nine),
the wave dampens very quickly, showing only two to three full swings.
The amplitude is much larger near the excitation site on the
left, and decreases rapidly along the loop arcade, possibly also
a consequence of the strong damping.
|
 |
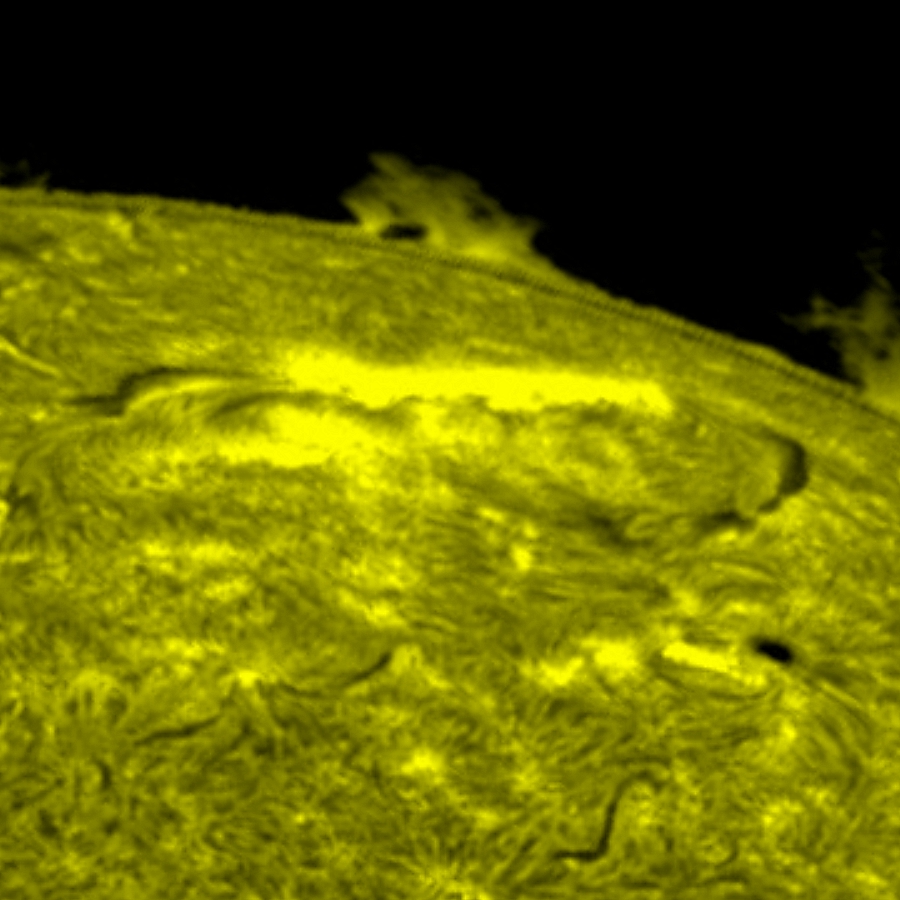 The image on the left (red/orange) is a deep exposure (220 seconds, instead of the standard 25 seconds) of Active Region 9513, taken on 3 July 2001, around 00:07 UT, taken in the 171Å (1 million degrees) pass band. The righthand image (yellow) is part of a full-disk Halpha image from Big Bear Solar Observatory, from which approximately the same area was cut out. The TRACE image shows the magnetic plage, covered by the bright ``moss'' pattern of emission that is at the base of the bright, hot coronal loops at temperatures of some 3 million degrees. The much cooler (1 million degree) loops at the outer perimeter of the magnetic region stand out as high structures, brightest near their lower parts. Between the patches of moss over the two opposite magnetic polarities, there is a filament (also clearly seen in the Halpha image), that consists of an arcade of sheared loops, above which faint, thin loops are seen at 1 million degrees with much less shear. Notice also the structure of the quiet-Sun corona, the absorbing spicules sticking out above the edge of the Sun, and the prominences clearly seen as bright structures in the H alpha image above the edge of the Sun; these structures are hard to recognize as dark, absorbing features in the coronal TRACE image because of the bright foreground emission. The TRACE image has been
scaled to show the weakly emitting features (linearly up to 600 DN),
reducing the contrast in the brightest structures (shown on a logarithmic
scale up to 3000 DN). The images were rotated over -55 degrees, and
a weak high-pass filter was applied to sharpen it somewhat.
|
 |
On 15 June 2001, Active Region 9502 produced an M6.3 class flare,
starting around 10:01 UT (see the
GOES X-ray plot)). The image on the left shows the flare/mass ejection
just as the filament begins to straighten and rise, with the flare
brightening underneath it. A (AVI/Cinepak; 4.8MB)
30-min. movie shows the initial
phases of the event: a small filament destabilizes, and erupts, with
cool material being thrown towards the west (up in this rotated image).
Notice how the magnetic field responds; particularly the rapidly
shrinking loop in the upper left corner after the mass ejection is
worth noticing. Some hours earlier, around 06:34 UT,
the same region showed another
instability associated with a C3.8 flare; this (QuickTime/JPEG-A; 4.7MB)
movie (courtesy Dawn Myers)
shows another loop oscillation.
|
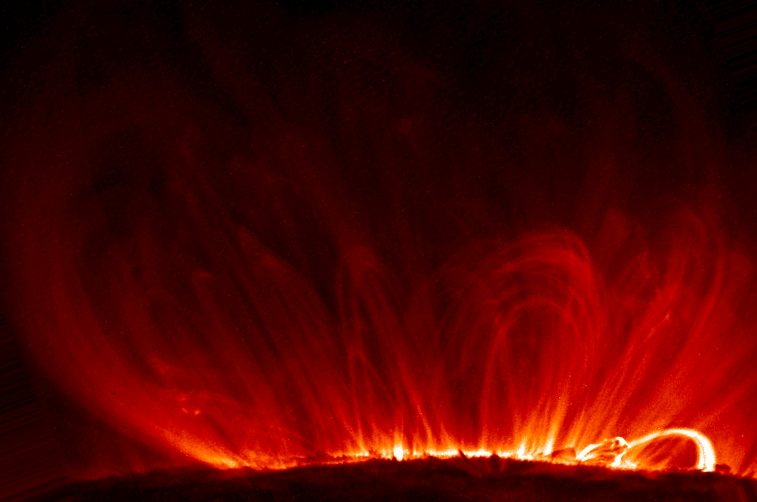 |
The TRACE orbit did not intersect the path
of the
total solar eclipse of 21 June 2001, so the Sun remained in full
view from the satellite. Hence, TRACE could observe the highly
structured corona over the active region right at the edge of the
Sun. This image was taken at 12:19 UT (in the 171Å passband; one
million degrees) near the time of greatest eclipse, some twenty minutes
before it became visible from the African continent in Angola. (The image has been rotated over 70 degrees; the field of
view in the full image is 280,000 by 190,000 kilometers).
|
|
| Home | Mission | Instrument | Team | Operations | Results | Images | Movies | Education | Site Info. | |