

The TRACE images may be used without restrictions
in publications of any kind. We
appreciate an acknowledgement indicating that
the Transition Region and Coronal Explorer, TRACE,
is a mission of the Stanford-Lockheed Institute for Space
Research, and part of the NASA Small Explorer program. More information on
TRACE and other TRACE images can be found
here.
 |
On 17 September 2001, TRACE observed the western limb near Active
Region 9612, a lonely region in the norther hemisphere. Far to the south
(compare this
SOHO magnetogram taken
3 days earlier) were ARs 9608/10/18. This image
in 171Å (rotated over +90 degrees)
shows the interaction of the fields of AR9612 and its distant neighbors:
a big tail-like configuration floats in the corona to the right of
the active region. This appears to be a coronal null point, where fields
of the neighboring regions cancel. The
(QuickTime/JPEG; 12.2MB)
(negative) movie in 171Å
shows the evolution of the field around that point, and the draining
of hot material from the corona towards the solar surface.
|
 |
These images show a
conjunction of Active Regions 9620, 9621, 9623, and 9626; each of these
regions is rather small, and they are all packed within the TRACE field of
view. Moreover, the orientation of the regions is rather peculiar (lower
image, from SOHO/MDI),
leading to a configuration in which a the strong positive (white) polarities
define a rectangle, with most of the negative (black) polarity lying
outside this rectangle. Notice the many connections between these
regions that show up in the corona (top image, taken in the 171Å
channel of TRACE, mostly sensitive to gas emitting at 1 million degrees).
In particular, notice the X point, a magnetic null point floating in
the corona, visible in the upper right quadrant. A five day movie shows
at least four such X points at different locations between these regions.
Here is a (QuickTime/JPEG; 6.0MB)
movie in 171Å
selecting one frame every 10 minutes, shown at half the usual
resolution (i.e., one pixel is now about 720 km on the Sun).
Movie courtesy of Charles Kankelborg.
|
 |
This image was taken on September 9, 2001 at about 13 UT, in the 171Å
bandpass (1 million degrees). This images shows some bright loops
and at the foot of those loops one can see the mossy structure that
lies at the base of much hotter - here invisible - loops.
The (QuickTime/JPEG; 4.3MB)
movie in 171Å shows
a failed eruption of a `small' filament; the field of view is
240,000 by 180,000 km. Courtesy: Dawn Myers.
|
 |
The TRACE team discovered that coronal loops could oscillate after a
flare that occurred on 14 July 1998 (this event was decribed in detail in this
publication).
We have shown half a dozen cases on this TRACE website before. Now,
we have a total of 17 cases, some clear, some not so clear. Look at
the movies and images compiled here.
To learn more about damped harmonic oscillators, click on the image
to the left. To see a simulation of an oscillating string, click
here
for the fundamental mode, and
here
for a superposition of three modes.
|
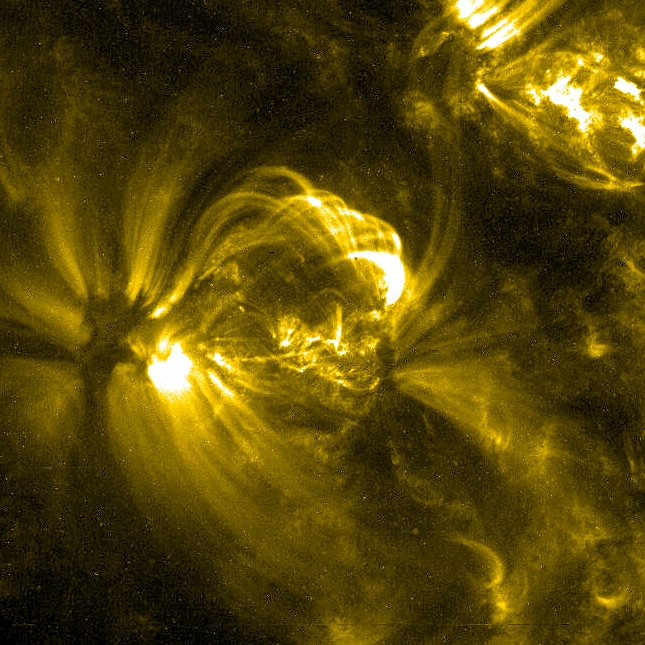 |
On 9 August 2001, around 03:10 UT, a small eruption occurred in Active
Region 9566. The (QuickTime/JPEG; 7.6MB)
movie shows this eruption,
and the subsequent development of cooling post-flare loops (shown in
the image to the left, taken at 04:54 UT). These cooling loops brighten
as material reaches about 1.5 million degrees and fade away again as they
become too cool to see in the TRACE 171Å pass band. Even with the
help of the movie it is impossible to put these loops in their 3-dimensional
perspective; we need at least to see these loops at different temperatures
at the same time in order to begin to understand their braids above the
solar surface.
|
 |
On 23 November 1998, an eruption occurred over the southwestern
limb of the Sun. These observations, made in the 1600Å pass band
of TRACE (most sensitive to material of approximately 100,000 degrees,
but also showing emission from much cooler material if bright enough)
show how gas is thrown up into the outer atmosphere of the Sun.
The first image was taken at 6:34:05 UT,
and then 30, 60, 90, 125, 148, 191, 224, and 257 seconds later.
Courtesy Zoe Frank, LMSAL.
|
 |
At about 00:10 UT on 28 August, 2001, Active Region 9591 produced an
M-class flare. Here we show the flare at its peak in each of 4
wavelengths. Clockwise, from lower left to lower right they are:
171Å (00:10:01 UT), 195Å (00:09:26), 284Å
(00:09:47), 1600Å (00:09:07). The flare occurred in the upper
right of the field of view, visible in the two bright regions that
appear in each of the different wavelength images. Bright, complex
structures in the area of the flare reveal the complex, multi-thermal
dynamics involved. The 171Å image shows plasma at about 1
million degrees; the 195Å image shows plasma at about 1.5
million degrees but also
shows very hot flare material through Fe XXIV lines; the 284Å
image shows plasma between one and four million degrees; while the
footpoints of the loops involved appear bright in the 1600Å
image. Courtesy: Dan Seaton, Smithsonian Astrophysical Observatory.
|
|
 The visible-light image shows small concentrations of magnetic field embedded between the convective granular cells, together with some large concentrations that show up as dark sunspots and pores. Above the small concentrations, the Ca II K chromosphere is bright, the sunspots still dark. The H-alpha emission, formed over a larger range in heights, begins to show the shape of the outer-atmospheric magnetic field. Even higher, the corona has many temperatures, of which the TRACE image shows only the gas with temperatures close to a million degrees. The region in these images is NOAA Active Region 8227, observed on 30 May 1998, at 14:40 UT, when the region was at N27 E10 on the Sun. The field of view in each of the images is 108 by 108 arcseconds (725 km per arcsecond). The observations in the G-band, Ca II K line, and H alpha were made at the Swedish Vacuum Solar Telescope (SVST), La Palma by Bart De Pontieu (who provided us with the images set). The 171Å image was made with TRACE.
N.B. The full-size images behind the thumbnails above
are 1300 by 1300 pixels each, and range
from 0.33 to 1.0 MB.
|
 |
On 24 August 2001, an M1.1 flare started to go off at 8:48 UT (NOAA/GOESS
list). These two TRACE images were taken at 8:57, in the rise phase
of the flare. The gold image shows the
flare in the 284Å passband, which shows emission at about 2
million Kelvin. The red image shows
the flare in the 1600Å passband; the bright features in the 1600Å
image are emitting at about 100,000 degrees, while the surrounding darker
areas are emitting at about 5,000 degrees Kelvin. The field
of view is a square of approximately 380,000 km to a side. Courtesy Dawn Myers.
|
 |
This composite of images taken by TRACE in its 284Å channel (most
sensitive to emission at 2 million degrees) shows an
eruption in Active Region 9591 (near the southeastern limb; the images
have been rotated by -90 degrees so that north is to the right).
The field (170,000 by 230,000 km; 2x2 summed CCD pixels) shows a
small brightening around 14:55 UT, followed by a surge of bright,
hot material about 4 minutes later. While this is still high in the
corona, a second event starts around 15:05 UT, bringing more material up,
which then flows over the top of the loops. Within 5 minutes, so much
of this has cooled, that dark, absorbing clumps are seen embedded within
the hot gas. Within 20 minutes, almost all gas has cooled to less than
about 20,000 degrees, and the entire cloud is dark, outlining much of the
loop system. After a short gap in the data stream, all is back to normal
when we observe the Sun again 40 minutes after the start of the
action.
|
|
| Home | Mission | Instrument | Team | Operations | Results | Images | Movies | Education | Site Info. | |