

The TRACE images may be used without restrictions
in publications of any kind. We
appreciate an acknowledgement indicating that
the Transition Region and Coronal Explorer, TRACE,
is a mission of the Stanford-Lockheed Institute for Space
Research, and part of the NASA Small Explorer program. More information on
TRACE and other TRACE images can be found
here.
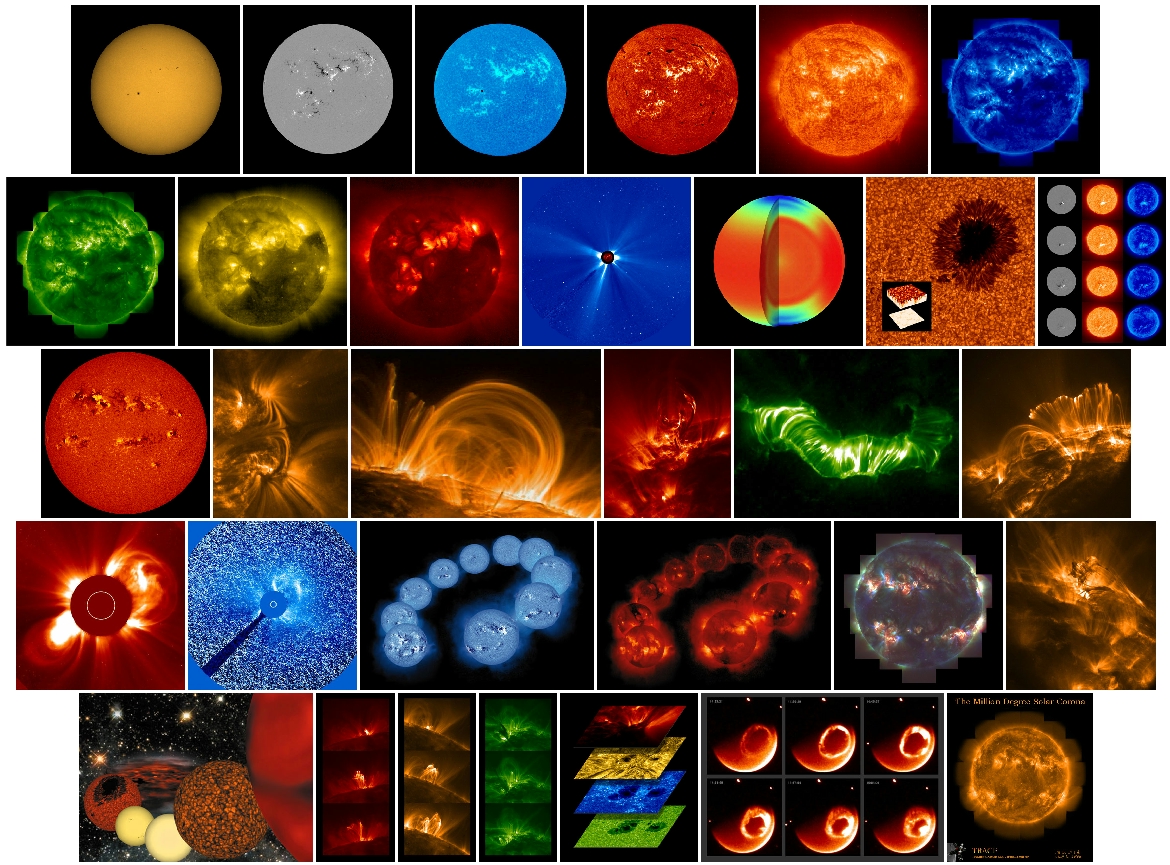
Exhibit on the web Go to `Arts in the Academy' |
Most people don't give the Sun, the nearest of all stars, a second thought.
Neither its presence nor its apparent stability is questioned. If it were, it
would quickly become clear that the Sun is a star whose variability affects
us in many ways. It impacts Earth's climate with effects that are yet to be
fully understood. It also affects our technology, as eruptions on the Sun
interrupt communications, play havoc with navigation systems, generate
radiation that is harmful to astronauts and airline passengers, and
occasionally push power grids to failure. The cause of this variability is
the Sun's magnetic field.
The magnetic field of the Sun shapes its atmosphere from the surface to well beyond the orbit of the Earth. It heats the atmospheric gases to temperatures that are nearly a thousand times higher than the temperature of the surface. This atmosphere glows at many different colors (wavelengths), depending on the temperature of the gas. Special optical systems and detectors allow us to image this mysteriously glowing Sun, with "false" colors added, giving visual form to things our unaided eyes could never see. An exhibit, on view at the National Academy of Sciences from February
19 to August 15, 2002, presents recent research and pictures of the
sun. The exhibition encompasses images from the NASA Transition
Region and Coronal Explorer (TRACE), the Extreme Ultraviolet Imaging
Telescope (EIT), the Large Area Solar Coronal Observatory (LASCO), and
the Michelson Doppler Imager (MDI) telescopes on the ESA/NASA Solar
and Heliospheric Observatory (SOHO).
|
 |
From early November through the end of
February the orbit of TRACE puts the Earth between the
spacecraft and the Sun for a fraction of the time, thus obscuring our
view of the Sun. This ``eclipse season''
is generally a period of simpler observing, often in the visible and
ultraviolet wavelengths rather than in the EUV, and with substantial gaps in
our otherwise continuous viewing of the Sun. This ``picture of the day'' site
will not be updated during that period (but we'll save the interesting
images for the spring of next year!). As a parting gift for the year,
we put together a collage of some of the many images shown at this site
in a one-page calendar for the year 2002. You're welcome to download a
(6.6MB) postscript version of it.
|
 |
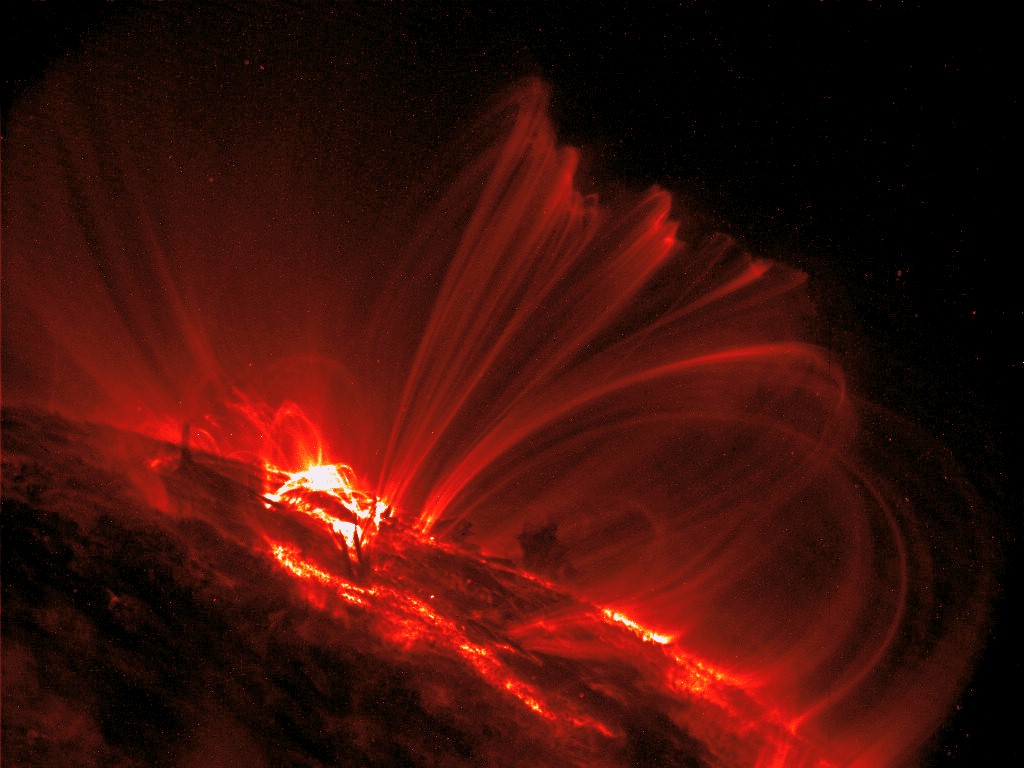
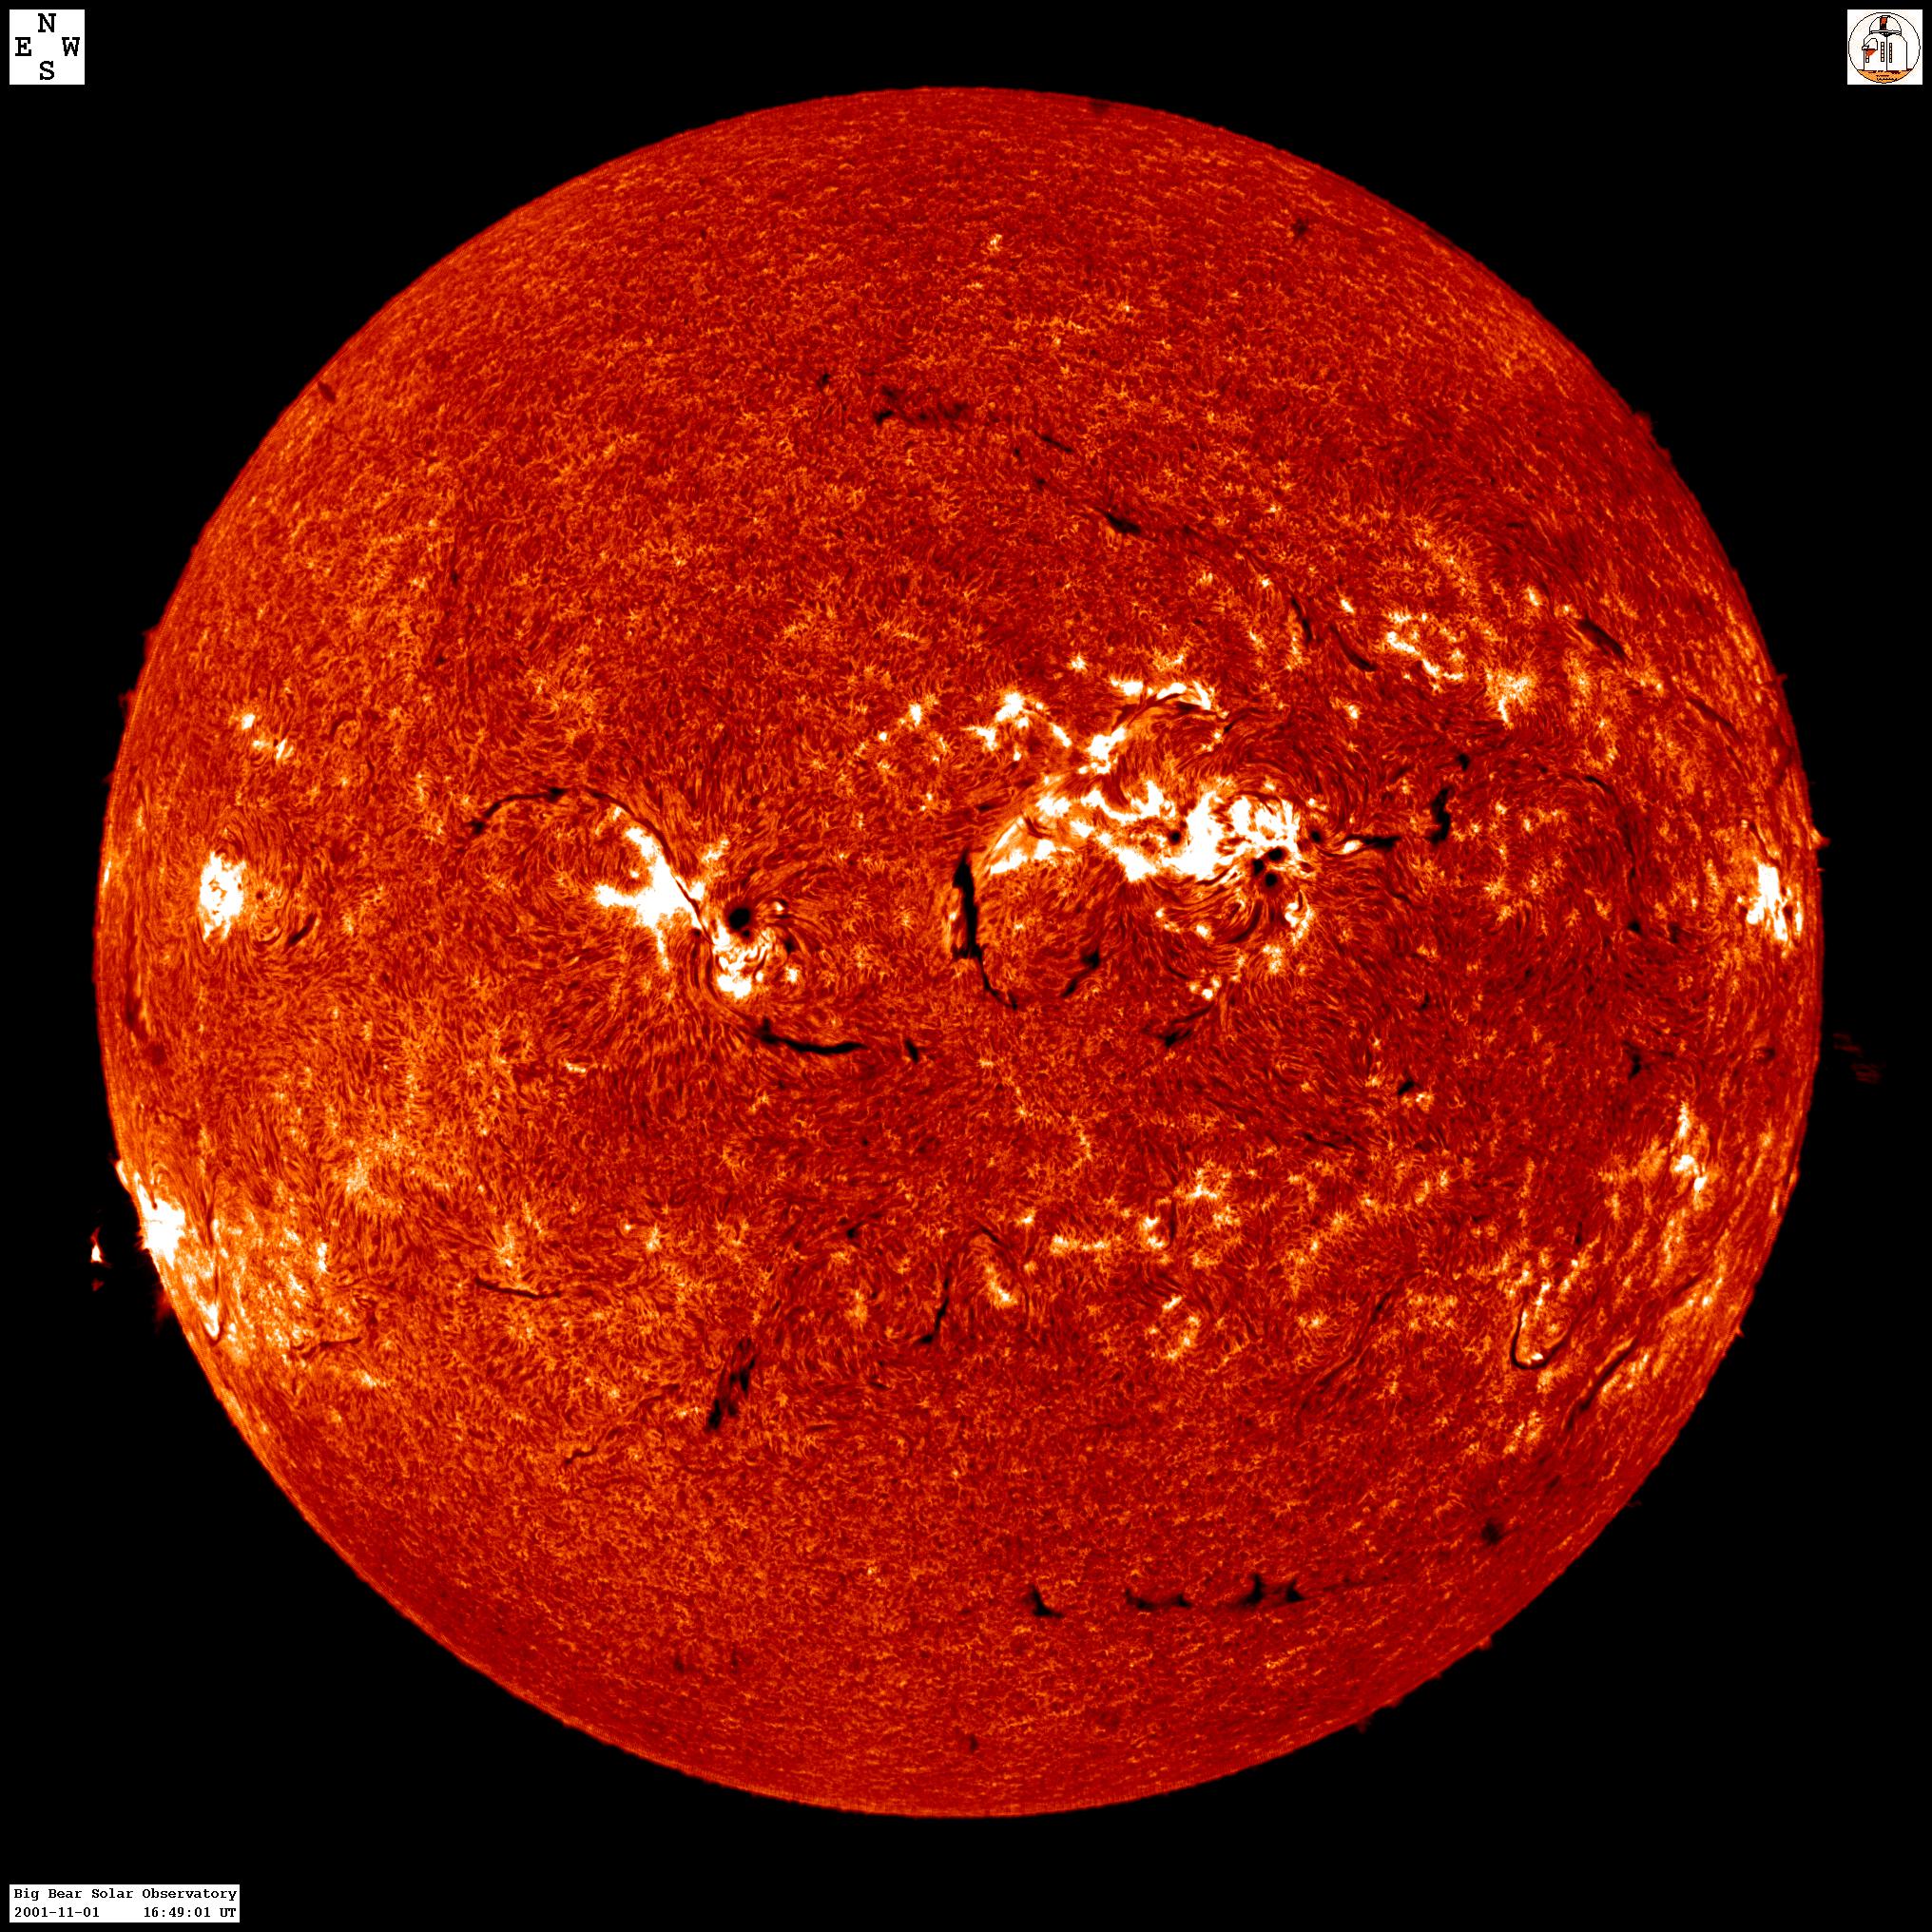
This image shows an eruption in progress in Active Region 9682 (observed
in the 171Å pass band, most sensitive to emission at 1 million
degrees). The event started shortly after 11.30. The (QuickTime/JPEG; 5.6MB)
movie in 171Å shows
the evolution of the eruption for an hour. Notice the apparent twisting
of the field, and the intricate fine structure in the emission that suggest
blobs of material moving along and distorting the magnetic field.
Compare the H alpha image
obtained at Big Bear Solar Observatory.
|
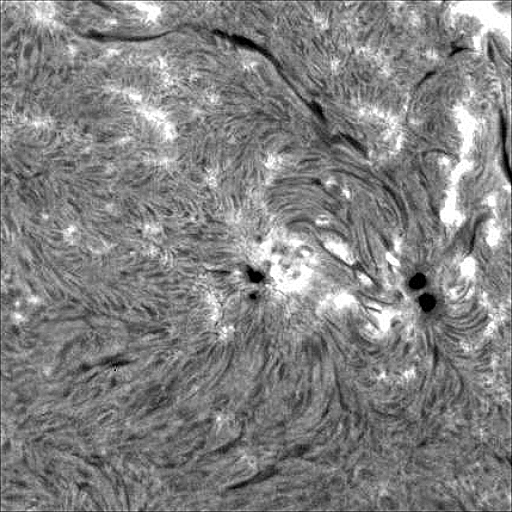 |
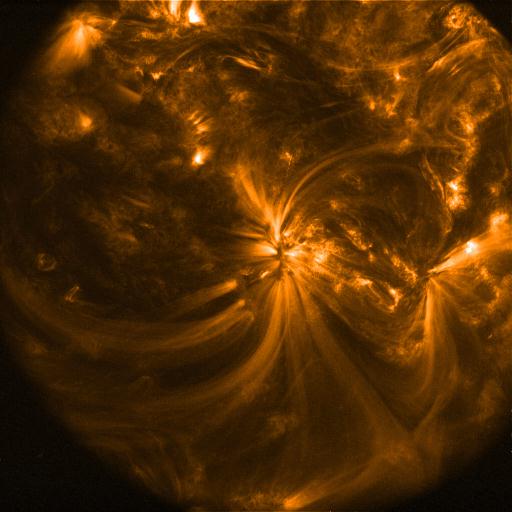
The top image of Active Region 9678 was taken with TRACE on 28 October 2001 at
11:02 UT in the
171Å passband, showing emission from gas at approximately 1 million
degrees (the area is 512 by 512 arcseconds, binned 2x2 relative to the
usual resolution). The image is centered on the sunspots in the western
side of the bipolar magnetic region. A fan of cool loops radiates
away from this cluster of magnetic flux, in part reaching over the
active region to connect to the field in the eastern side, in part
to other nearby field clusters. The
twist in the coronal loop fan
as one looks further and further away from the region
is indicative of large electrical currents through spot and overlying
corona. These add their own field component to what otherwise would have
been much more like the simple field lines over a horseshoe magnet.
The lower image is a hydrogen alpha image taken at Big Bear
Solar Observatory, on the same day at 15:54 UT (the alignment and image
scale are approximate, and the image was high-pass filtered). Notice
that a similar spiraling of the field can be seen even in the chromosphere
close to the solar surface. (TRACE image courtesy Dawn Myers)
|
 |
The magnetic field in the solar atmosphere shapes the structures
that we see, as the emitting gas can generally only move along the field.
Sometimes, however, packets of gas are accelerated so much that they
can shoot through the magnetic field almost in a straight line. This
(QuickTime/JPEG; 5.0MB)
movie in 171Å
of a surge (and some loop brightenings) at the east limb of the Sun
shows an example of that. But despite the large initial speed it
has difficulty escaping the Sun: much of the
material in this event
slows down, being pulled back by the solar gravitational field,
and - as it cools and darkens - slides back to the surface.
Courtesy Charles Kankelborg.
|
 |
Active regions 9628 and 9632 are rotating over the southwest limb of the
Sun in this image, making a nice display of thin loops arching above them.
This image was taken in the Fe IX/X 171Å channel at 23:59 UT on the first
day of the new fiscal year, 01 10 01. North is to the left, west
to the top. The field of view is 512 arc sec N/S and 384 arc sec E/W.
These active regions produced several M and X flares during their
disk passage, including the M1.2 flare at 23:40 UT that is seen in this
image. Courtesy Dick Shine.
|
 |
On 3 October 2001 TRACE observed a
small filament eruption (C6.1 flare,
not obviously associated with a coronal mass ejection)
from Active Region 9636. The event started around 06:38 UT when a compact
filament started to rise. At 06:40 UT a compact brightening occurred
in the 171Å channel (most sensitive to emission from
gas at 1 million degrees), and within 2 minutes of that, the eruption
had started, with material moving upward with velocities in
excess of 600 km/s. From about 06:46 UT onward cool, dark material could be
seen moving up surrounded by bright, hot material. At 07:02, TRACE
moved into a high-radiation SAA zone. By the time it came out, at
07:21 UT, the erupting material had disappeared, and only a cooling set
of loops was left at the site of the eruption. The composite image
on the left is shown at half the resolution. Here are the four panels
at full resolution of one pixel for each 375 km:
1,
2,
3,
4.
|
 |
Filaments are complex, dynamic magnetic structures, in which cool,
chromospheric material is suspended in the otherwise hot corona. The top
image to the left is a snapshot (at 11:30:53) out of this
(QuickTime/JPEG; 6.7MB)
movie in 171Å,
which shows 4h 20m in the life of the filament. Notice how the cool
material, which shows up because it absorbs EUV light emitted by
hot gas behind it, seems to slosh back and forth as field and
gas pressures evolve. The lower image shows the filament in the Halpha
line of hydrogen, characteristic of gas around 10,000 to 20,000 degrees.
That image was taken at
Big Bear Solar Observatory at
16:05 UT on that day.
|
 |
Not only big filaments erupt. In the image
to the left, we see an eruption in progress from a small magnetic bipole
emerging to the northwest of AR9636, right next to a fan of relatively
cool loops emanating from a cluster of magnetic field in the quiet Sun
(this image was taken at 02:28 UT on 3 October 2001 in the 171Å channel,
sensitive to emission from about 1 million degrees; expanded by a
factor of two compared to the usual scale).
The (QuickTime/JPEG; 8.5MB)
movie in 171Å shows
the evolution of the emergence and eruption. The emergence started around
0 UT on 2 October. There are some small eruptive events along the way,
for example at 14:00 UT, 16:05 UT, 17:25 UT, and 22:18 UT. But around
02:22 UT on 3 October a much larger event occurs with bright and dark
material being lifted up through a cusp-like magnetic field structure.
Much of the cool material can be seen to slide down again after about half
an hour, absorbing light from the underlying brighter loops. After that,
the region's activity decreases, and the loops evolve smoothly.
|
 |
 An M9.1 flare (see the GOES X-ray plot) went off in Active Region 9632 around 04:41 UT. This TRACE image (left), taken in the 171Å passband (1 million degrees) shows the event developing into a mass ejection around 05:20UT, at about the time of maximum X-ray brightness. The animated gif on the right shows the coronal mass ejection as observed with SOHO's LASCO. |
|
| Home | Mission | Instrument | Team | Operations | Results | Images | Movies | Education | Site Info. | |