

The TRACE images may be used without restrictions
in publications of any kind. We
appreciate an acknowledgement indicating that
the Transition Region and Coronal Explorer, TRACE,
is a mission of the Stanford-Lockheed Institute for Space
Research, and part of the NASA Small Explorer program. More information on
TRACE and other TRACE images can be found
here.
 |
TRACE observed a very large X4.8 flare in the early hours of
23 July 2002 (the X-ray flare starts at 00:18 UT and ends at
00:47 UT). This (QuickTime/; 11MB)
movie in 195Å
shows the evolution of the flare at an 8-second image cadence,
from 00:20 through 01:30 UT. The brightening observed in the 195Å
channel (1.5 million degrees in quiescence, but much hotter during flares)
starts in a compact area, first seen in the diffraction pattern (causing
a cross formed by repeated but ever weaker flare cores) at 00:22:29 UT.
Substantial field deformations are then seen above the flare (in this
image that was rotated and flipped) as well as to the left. Then,
around 00:38 UT, even the quiet-Sun field below the flare deforms and
changes in intensity; perhaps we are seeing a wave expanding away from
the flare site. After about 00:50 UT not much action is seen: the loops
cool gradually back to their quiescent state. Note that the movie
was made with 2x2 on-chip summing, so the pixel size is ~750 km, twice
the usual size.
Courtesy: Dawn Myers.
|
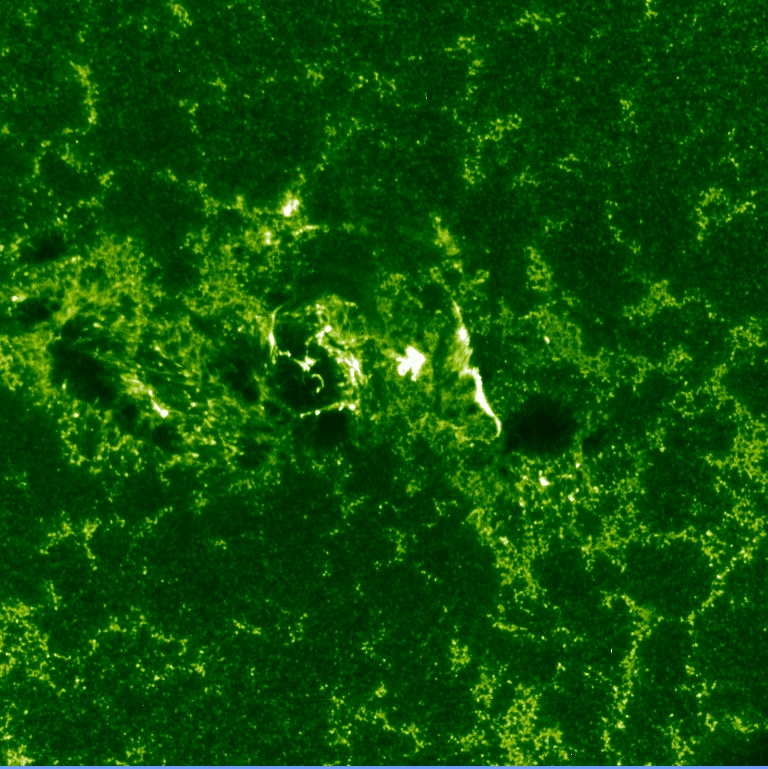 |
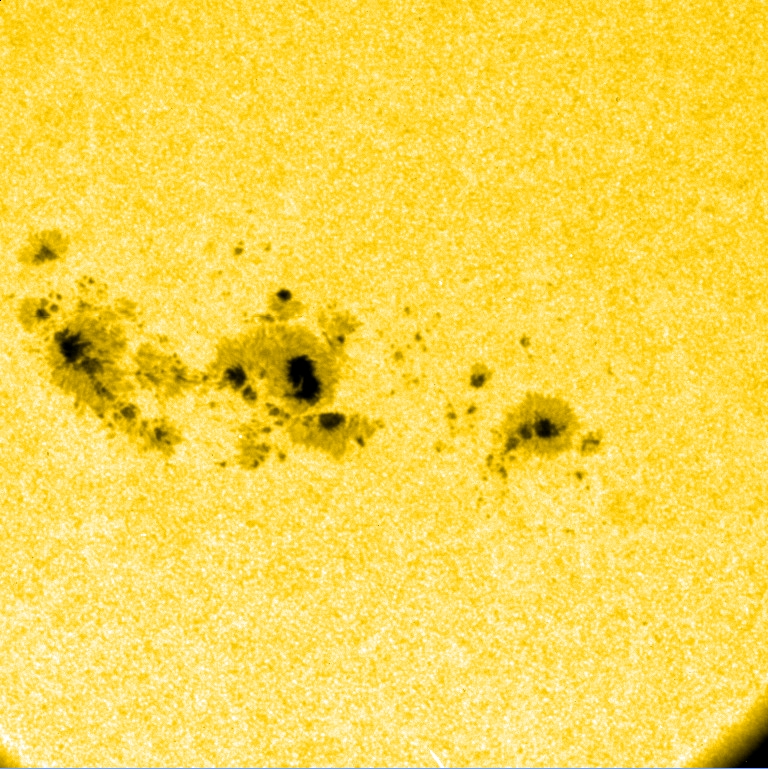
 On 15 July 2002 TRACE observed an X3.0 flare in its ultraviolet 1600Å channel (most sensitive to temperatures around 100,000 K, but also including much cooler continuum emission if that is sufficiently bright). The images to the left show a 1600Å taken at 20:00:20 UT, one minute into the flare according to the NOAA flare listing. The flare occurs between the western side of the leading spot and the central spot area (best seen in the white-light image, taken at 20:00:23 UT, shown below the UV image). The (QuickTime/JPEG; 7.7MB) movie in 1600Å shows the flare from 20:00 UT through 20:47 UT, using a 400x400 pixel cutout (field of view of 150,000 km square). The enormous intensity contrast makes it very difficult to show both the quiescent and flaring regions; the movie focuses on the flaring plasma, and shows the logarithmically scaled, negative intensity. The region was so bright that TRACE reduced the exposure times to as little as 1/625 seconds starting at 20:03 UT; the result is that the background emission disappears entirely and only detector and data-compression noise is seen outside the bright flare kernel for a while, until exposure times become longer than 1/150 seconds after 20:07:28 UT. The movie was made requiring a minimal interval between frames of 5 seconds; the original data has intervals as low as 2 seconds.
The movie shows an ejection originating from the eastern (left)
side starting at
20:03:38 UT, moving upward in a north-westerly (upper-right) direction.
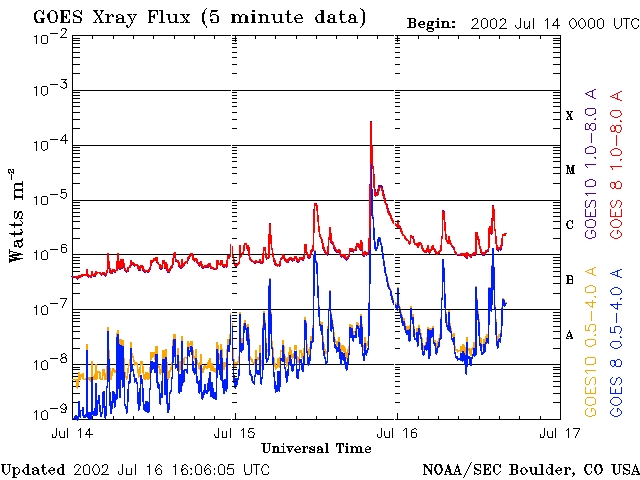
Then things seem to settle down, until there is a second ejection (compare
the GOES X-ray plot also shown above), this
time from the leading, western side, starting around 20:24 UT, and
moving in an easterly direction. Note that you can vaguely see
a post-flare arcade between the ribbons associated with the initial
flare/ejection. As the westernmost ribbon of that reaches a much fainter,
eastward moving ribbon coming in from the leading spot, the second
eruption occurs.
|
 |
This (QuickTime/JPEG; 5.5MB)
movie in 171Å shows observations of Active Region
10005, starting at 17:13 UT and lasting for 1h 25m. NOAA lists no flares
for this time interval, but the loops are clearly evolving rapidly
in intensity, and likely also in temperature. Note that the loops cross,
revealing that the arcade's magnetic field is clearly sheared. The
observations do not reveal, however, which loops cross above which; that
can only be revealed by detailed magnetic modeling. Courtesy Dawn Myers.
|
 |
Coronal magnetic loops can exhibit confusing dynamics.
This (QuickTime/JPEG; 2.5MB)
movie in 171Å
shows the evolution of a set of loops observed off the western limb
(rotated over +90 degrees). The loop tops appear to whirl and twist
over the course of this 85 min. long movie. What we are likely seeing,
is a rolling motion of a set of loops that outline a banana-shaped
volume that we view in a direction essentially along the banana. What
causes this rolling motion? It may be that we are seeing field rearranging
itself as the photospheric ``sources'' and atmospheric currents adjust.
See, for example, a review published in Solar Physics.
|
 |
This pair of images was taken on 24 April 2001, within four minutes of
each other around 12:50 UT. The top image is a TRACE 171Å image
(1 million degrees); the bottom image is the corresponding MDI magnetogram.
Notice the curious strand of white polarity south of the trailing spot
(left). That strand sits right underneath the bright ridge in the TRACE
image, associated with, but not quite at the small, dark filament.
We are still left puzzling over how to interpret this observation.
Suggestions are welcome.
|
 |
TRACE observed this filament
activation on 11 June 2002, from 18 UT through 19:40UT. After
a slow rise phase up to 18:34UT, the filament rises some 20,000 km (and
twists)
in half an hour (with a rise speed of 12 km/sec). Then, after a 15 min. gap
in the observations as TRACE flew through a radiation zone starting
around 18:54UT, the
filament segment that rose, disappeared or reconnected, leaving a
whispy, dynamic, and mostly transparent structure. What happened to
the filament? There was a coronal mass ejection observed starting
around 18:48 from neighboring AR9978 by EIT - perhaps the filament
observed by TRACE sensed the magnetic change occurring in that other region?
|
 |
The second Active Region Number 1: after having counted 10000 regions on the
Sun (starting on
January 5, 1972), the NOAA Space
Environment Center decided to keep the four digit system,
so that number 10001 (first numbered on June 15) was assigned number 1.
The TRACE exposures were made on 20 June 2002,
around 02:35UT; the image tends towards the red where the 171Å
emission (1MK) dominates, and towards the green where the 195Å
emission (1.5MK) dominates. The field of view is 1024 pixels of 0.5 arcsec
each, here shown binned 2x2.
|
 |
 TRACE observed this M1.5 flare on 1 June 2002, around 04 UT. The leftmost image (400 by 400 pixels of 0.5 arcsec each; field of view 150,000 km square) was taken just at the onset of the flare at 03:51:00 UT; a bright, small flare kernel can be seen in the center, with two brightening flare ribbons to the northeast and southwest (upper left and lower right). Only a minute later (2nd frame) the central kernel has become so bright that the diagonal structures of the diffraction pattern are clearly visible, revealing a flare kernel no larger than an arcsecond. After another minute (3rd image), the bright structure associated with a small, destabilizing filament is seen rising, throwing material up towards the lower-left corner. Within 45 minutes of the flare (4th image) all traces of a flare have disappeared, as has (most of) the small filament visible under the upper-left flare ribbon in the first frame. |
 |
TRACE observed this filament destabilization in Active Region 9957 on
27 May 2002. The filament starts to rise shortly before
18 UT; the X-ray flux (as recorded by the GOES satellite) rises
in step, and reaches its maximum around 18:10 UT. At that time,
the twisting filament has reached its maximum elevation of some
80,000 km. After
that, the field appears to evolve little, but the plasma within the field cools
and flows down to the solar surface along the new paths formed by the
distorted magnetic field. A subsequent C5.7 flare, starting at 19 UT,
does not seem to cause much field distortion; TRACE merely sees the loops
brighten and then drain as they cool.
The (QuickTime/JPEG; 9MB)
movie in 195Å (1.5 million
degrees as well as much hotter flare plasma) shows a field of view
of 150 by 150 arcseconds (recorded 2x2 summed on the CCD, and
expanded by a factor of two in the movie), at a cadence
of mostly 9 seconds, except during the flare phases, when is about a minute;
the images were rotated over +90 degrees so that
north is to the left.
|
 |
TRACE observed this small filament eruption on 13 May 2002, around 01UT,
at the south-western edge of the solar disk (the images were rotated
by 90 degrees, so that north is to the left). A small strand of
dark, cool material is seen to rise, slowly at first, but accelerating
later on. By 00:55UT the filament really takes off, heating up in the
process: the dark, absorbing strand changes into a bright, emitting
shape, with a temperature of at least 1 million degrees. Note that
first the leg on the left turns bright, followed by the topmost part of the
eruption.
|
|
| Home | Mission | Instrument | Team | Operations | Results | Images | Movies | Education | Site Info. | |