

The TRACE images may be used without restrictions
in publications of any kind. We
appreciate an acknowledgement indicating that
the Transition Region and Coronal Explorer, TRACE,
is a mission of the Stanford-Lockheed Institute for Space
Research, and part of the NASA Small Explorer program. More information on
TRACE and other TRACE images can be found
here.
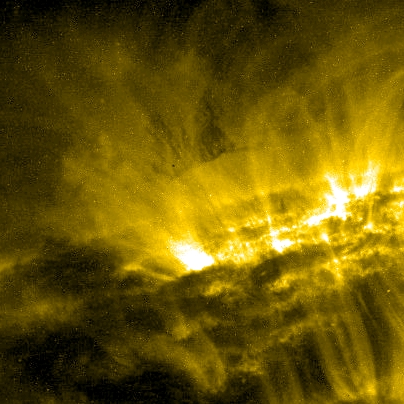 |
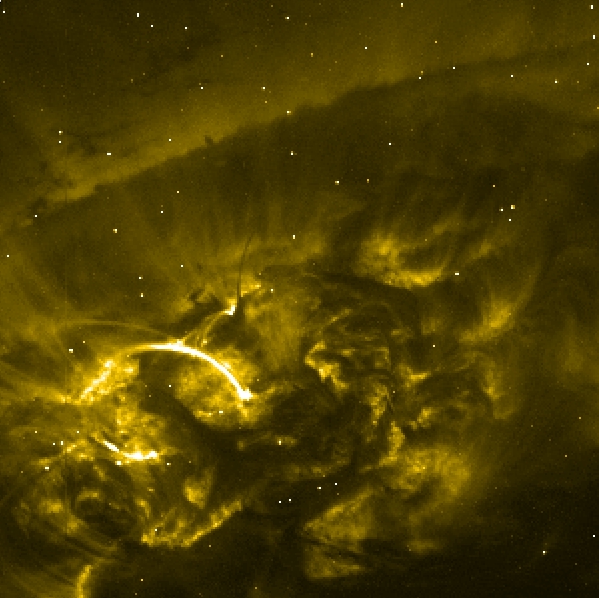
Hovering above AR137TRACE observed a dark prominence hovering above Active Region number 137 on 6 October 2002. The image, taken in 171Å (1 million Kelvin), shows only a feeble, dark structure, but look at the (QuickTime/JPEG; 10.4MB) movie (from 14:03 - 21:20 UT on 6 October 2002; 640x320 pixels of 375 km each): the cool matter (somewhere between 10,000 and 20,000 K) dances and whirls through the corona. The dark patch near the center of the movie is particularly puzzling: its sharp lower edge seems to be defined by field lines running nearly parallel to the solar surface (as theoretical models would have them), but the upside-down beard above it appears to defy all of our concepts: does this strike you as matter sloshing back and forth on horizontal field lines??? |
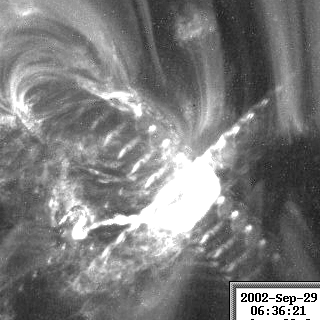 |
TRACE observed an M2.6 flare and associated
filament eruption in Active Region 10134 on 29 September
2002. This (QuickTime/JPEG; 1.6MB)
movie in 171Å
(from 06:34 UT to 07:20 UT) shows the initial eruption of the filament:
the material moves up toward us, but then appears to fall back down onto
the northern site of the flare. And if you are a believer in coronal
field oscillations, you may even see the material oscillate one and a
half times before it hits the (near-)surface layers.
|
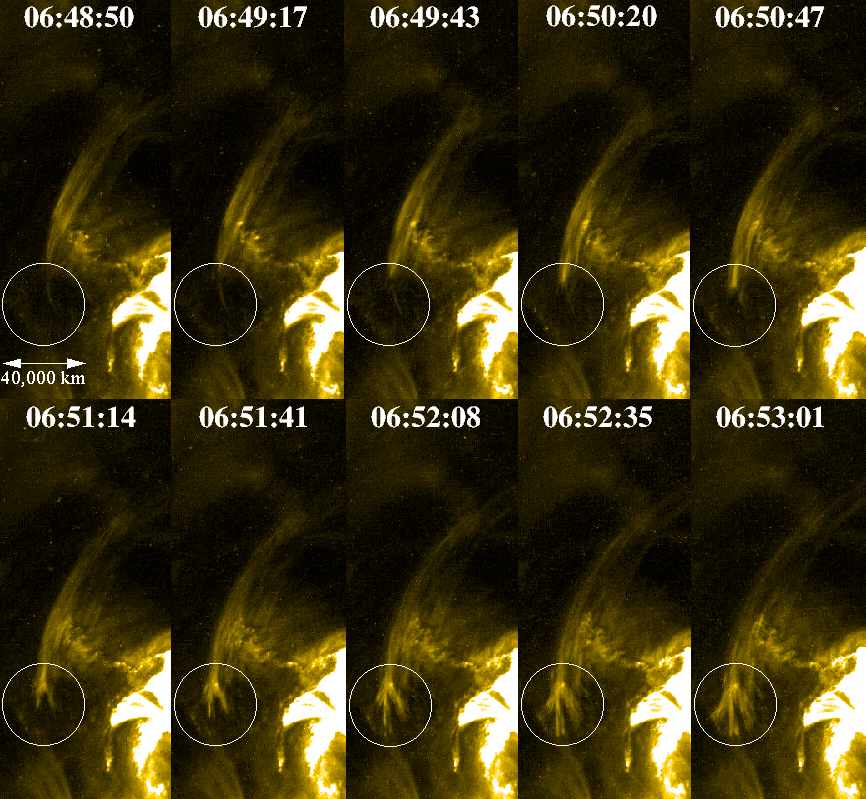 |
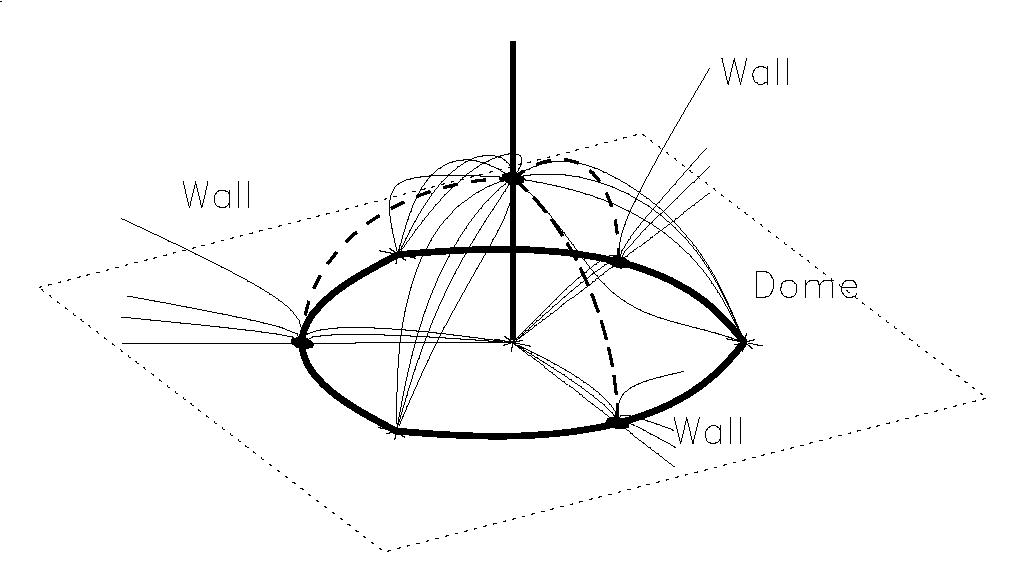
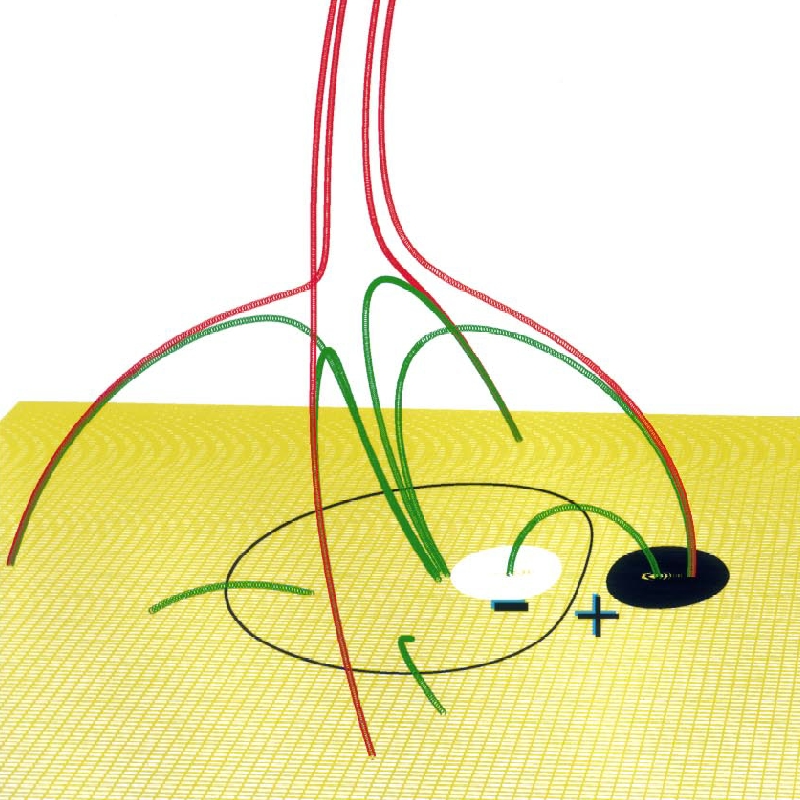 A stream of hot coronal gas, ejected earlier from a site well to the right of these image cutouts, is seen falling down in the series of TRACE images taken in the 195Å passband (mainly sensitive to emission from gas at 1.5 million degrees). On the top row, the gas is seen to simply stream down, guided by the magnetic field, as expected. But then, around 06:51 UT, the gas appears to hit an obstacle, and the jet splays out, continuing its fall, but now in a variety of different directions. What could cause this? We think that the magnetic field line along which the stream is propagating is connected to a location where the magnetic field suddenly diverges as it forms a dome over an underlying domain. Perhaps the topology is like that shown in the drawings above (from Brown and Priest, A&A 367, 339 (2001), and Antiochos, ApJ 502, L181 (1998))? |
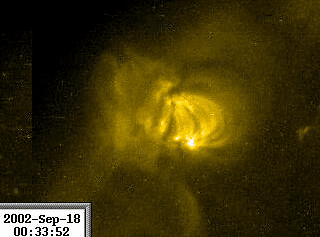 |
The emergence of active regions from below the solar surface has
not been seen very frequently. But here is one example, albeit of
a region so small that it has not been given an actual identification
number; yet it is definitely bigger than what we would call an ephemeral
region. The (QuickTime/JPEG; 3.3MB)
movie in 195Å
shows the evolution for almost 21 hours,
from 2002 September 17 08:27 UT through September 18 04:59 UT. The
emergence has already started before that, but it was beyond the
vignetted edge of the TRACE field of view. Yet around 14 UT on
September 18 a new bundle of flux emerges (oriented almost north-south,
rather than the usual east-west), gradually expanding into the corona
as it brightens. The field of view is 320 by 240 pixels of 375 km each.
|
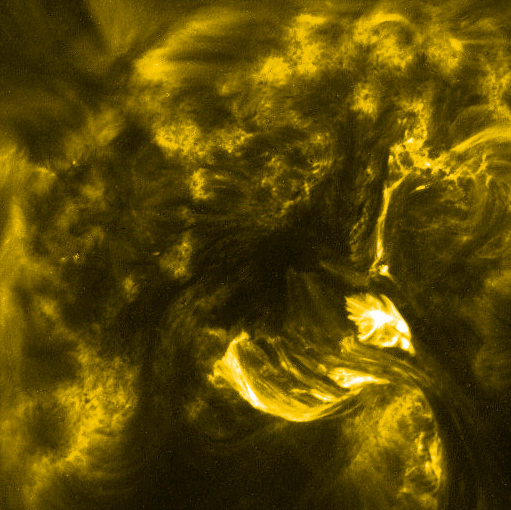 |
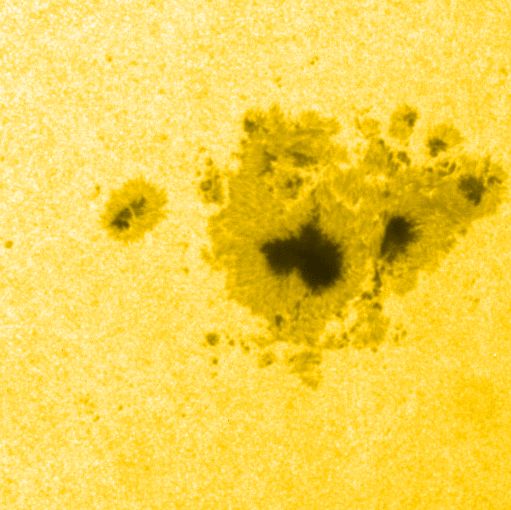 Active region
10069, containing a very large sunspot cluster, has been very active,
with repeated large flares and eruption. The image on the left (in
195Å, most sensitive to 1.5 million-degree gas, or much hotter
during flares) shows a ``small'' eruption in progress from the
southern edge of the spot group. The green image above shows the
1600Å image of the near-surface layers, revealing the footpoints
of small magnetic-field clusters as bright kernels, while the major
spots are dark, as they are in the white light (visible) image (shown
in yellow). The images (with approximate alignment)
were taken around 10:20 UT (WL, 1600Å)
and 10:40 UT (195Å); the field of view is 510x510 pixels of 375 square
kilometers each. |
 |
On 24 August 2002, TRACE observed this X3.9 flare in Active Region 69
at 00:50 UT in the 195Å
pass band. This image, taken around 02:42 UT, shows the cooling phase
of the flare, in which part of the
material involved in the flare has cooled from several million degrees
to some 10,000 to 20,000 degrees. That cooler material is no longer
transparent for the extreme ultraviolet radiation emitted by the hot
gases behind it; it therefore appears as dark strands as it slides
along different lines of force of
the magnetic field towards the solar surface.
Image courtesy of Dick Shine.
|
 |
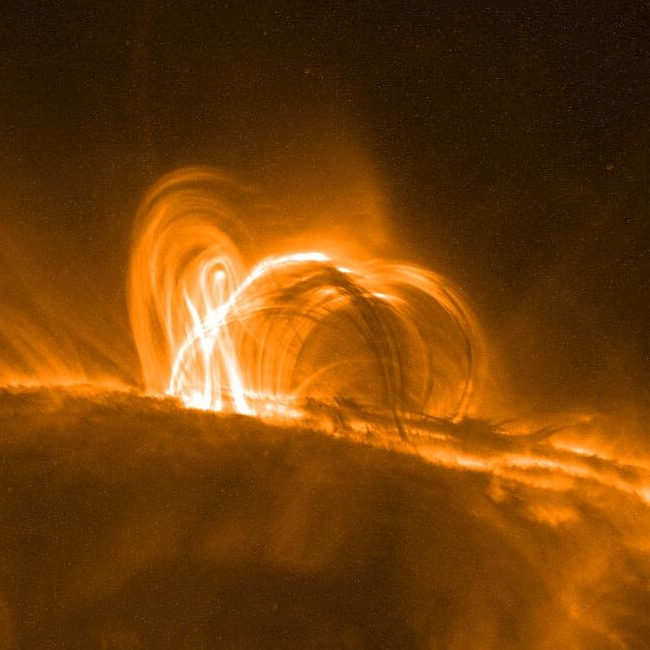
Another major flare in active region
10069. The flare, listed as an X1.0 flare based on
GOES data at NOAA's SEC, was observed very well with TRACE pointing right
at it's core, observing in the 195Å pass band at about a 15 second
cadence. In the middle of the impulsive phase, that started at 05:28 UT,
the 195Å image on the left was taken. It shows a very compact
flare kernel, where it all starts, repeated in
an X-shaped pattern that is caused by the wire mesh that supports the
front window of the TRACE telescope. The flare is associated with an
eruption that sprays material in various directions from the northwest
to the southwest. The white-light image on the
right reveals that the initial flare starts between the leading
dark umbral fragment and the smaller, pore-like structure below it.
The field of view is a square with sides of 260,000 km (or 175,000 miles).
|
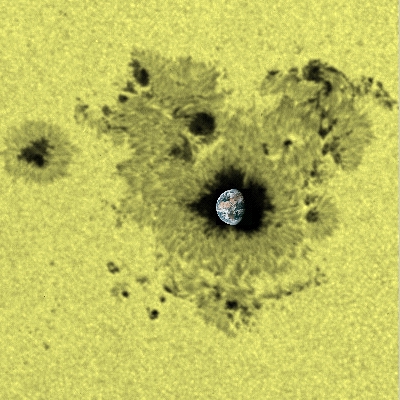 |
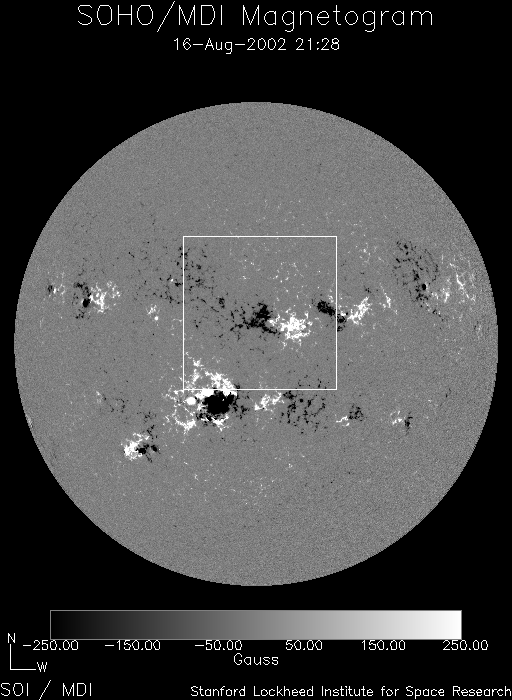
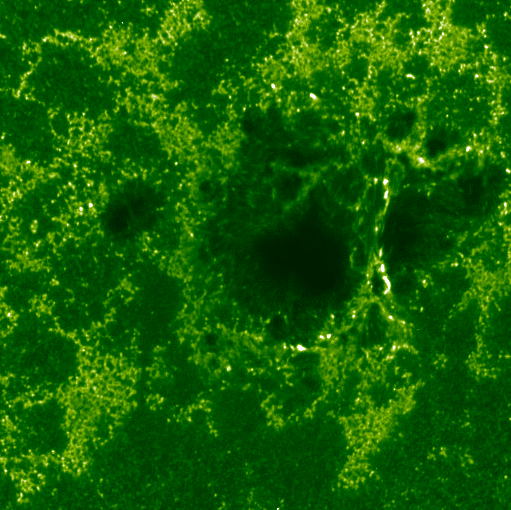
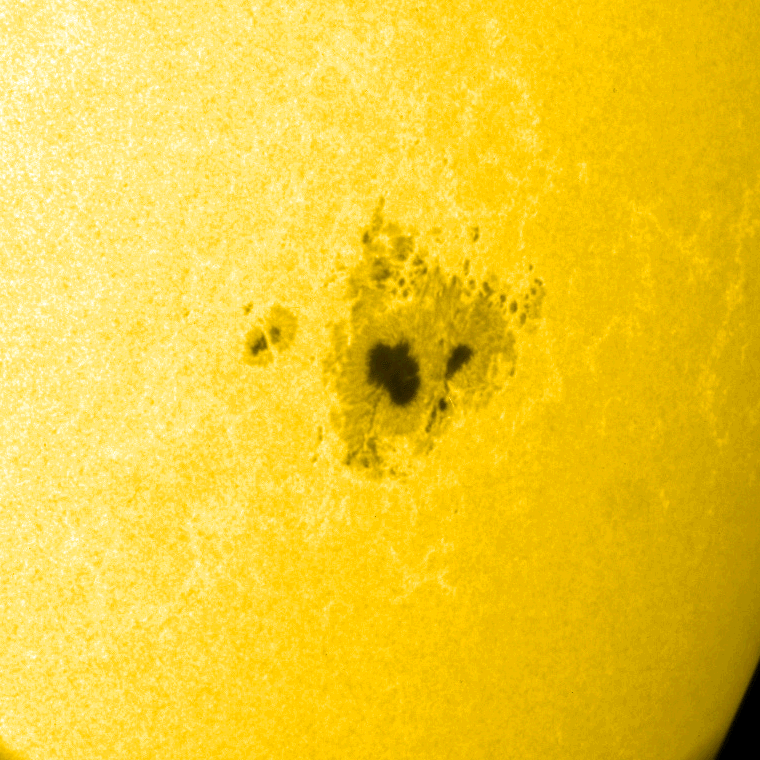
On August 16, the sunspot in Active Region 10069 was large enough
to swallow the entire Earth (shown overlaid on the TRACE white-light
image taken at 15 51 UT; to scale). At that
time, the spot cluster already covered 1,400 millionths of the
visible solar hemisphere. It continued to grow for a few more days,
reaching very nearly 2,000 millionths of the hemisphere. Its
complex Beta-Gamma-Delta configuration (see the magnetogram above)
led to a series of C and M
class flares.
The field of view is 400 by 400 pixels of 375 square kilometers each.
|
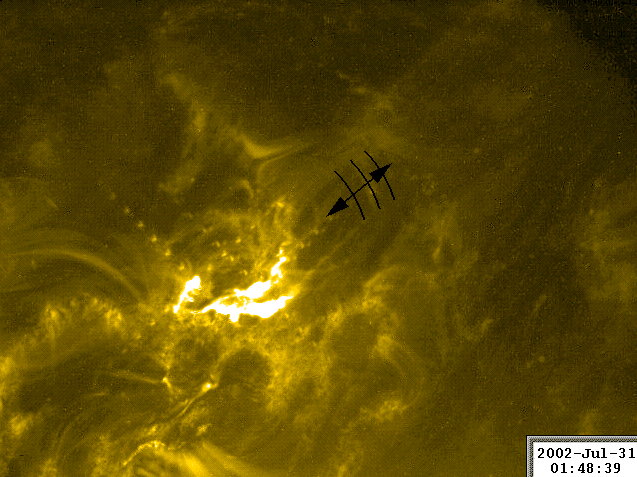 |
An M1.2 flare was observed in Active Region 10039, starting at
01:39 UT on 31 July 2002. This (QuickTime/JPEG 3.5MB)
movie in 171&ARing; shows
the field opening up towards the upper right, as if a filament
eruption were occurring. But TRACE saw no evidence of dark matter
at chromospheric temperatures being lifted up. Then, at about 01:44 UT,
a loop (marked in the image to the left) is seen to retracting from
what likely was a reconnection site, reforming loops from the
recently opened magnetic field. As the loop moves downward, it
clearly oscillates also: we see 4-5 swings, rapidly decreasing in
amplitude, with a period close to 2 minutes.
|
 |
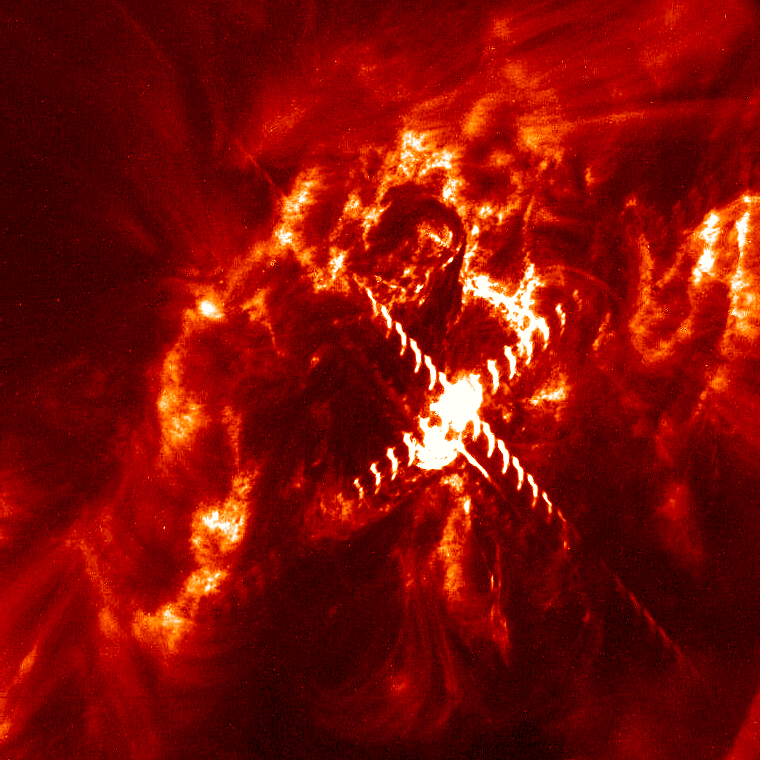
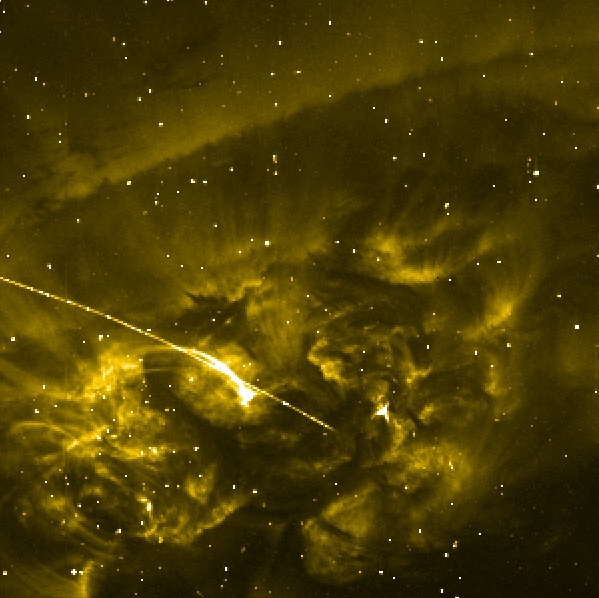
Crossings and coincidencesCoincidences often are a source of puzzlement. The top image shows Active Region 10039 (of X and M flare fame, see an earlier POD entry) observed by TRACE in the 195Å (1.5MK) pass band. The image was taken on 24 July 2002, at 05:01:53 UT (and rotated by -90 degrees). It shows the active region near the edge of the solar disk, with a dark filament running through it. Crossing it, with fields at essentially right angles, are some bright loops (which means, by the way, that there must be a lot of shear - or electrical current - in this configuration). But then there is this bright, straight line. Although it certainly looks like it is aligned with the loop, it is offset by just enough to make us realize that it is in fact the trace of an energetic particle, probably an electron that skimmed the TRACE detector, leaving a bright trail behind it. All the other particles instead went right through the detector, leaving a multitude of bright pixels; we usually remove these, but left them in these images for comparison. And then there is another odd image: the lower image, observed at 05:23:29 UT shows two faint loops coming together right at the apex of the bright loop that (still) crosses the filament. If you see the movie, you would think that the activity in the filament actually touches that bright loop to cause brightenings and downflows. But it is likely that instead the footpoint of that activity is not at the loop arching over the filament, but instead right below it as seen in projection. And then again .... we will be looking at this event for a bit longer, just to be certain. The ``crossing loops'' were pointed out by Mark Weber
(Center for Astrophysics).
|
|
| Home | Mission | Instrument | Team | Operations | Results | Images | Movies | Education | Site Info. | |