

The TRACE images may be used without restrictions
in publications of any kind. We
appreciate an acknowledgement indicating that
the Transition Region and Coronal Explorer, TRACE,
is a mission of the Stanford-Lockheed Institute for Space
Research, and part of the NASA Small Explorer program. More information on
TRACE and other TRACE images can be found
here.
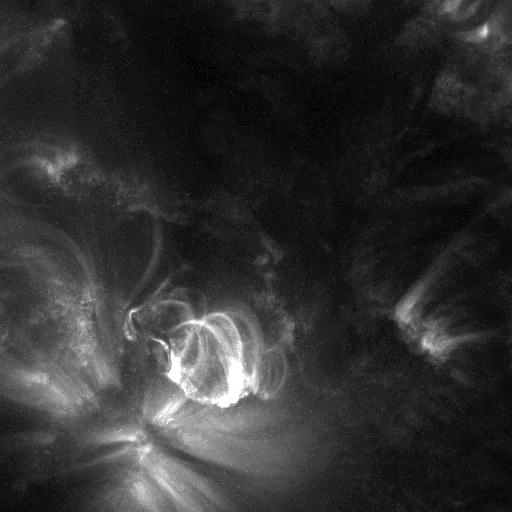 |
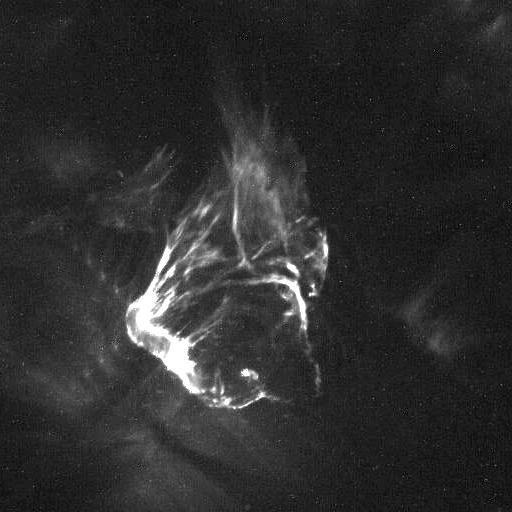 On 22 January 2003, TRACE observed this M1.2 flare in Active Region 10260, then near the center of the solar disk. The image on the left (taken in the 171Å pass band at 04:21:26 UT) shows the pre-flare conditions (the X-ray flare does not start until 04:35 UT according to the GOES data). In it we see a small, dark filament to the left of some bright compact loops, and to the north of a sunspot loop fan. The small brightening beneath it is the start of what turns into a large flare with a filament eruption. The image on the left (taken only 24 minutes later) shows the eruption in progress with bright ribbon below and a tangled, erupting field above it. In the ten minutes that the eruption proceeded most quickly, the projected velocity of the front of the eruption is close to 200 km/s, but the inclination is probably substantial, so that the real speed is significantly higher. |
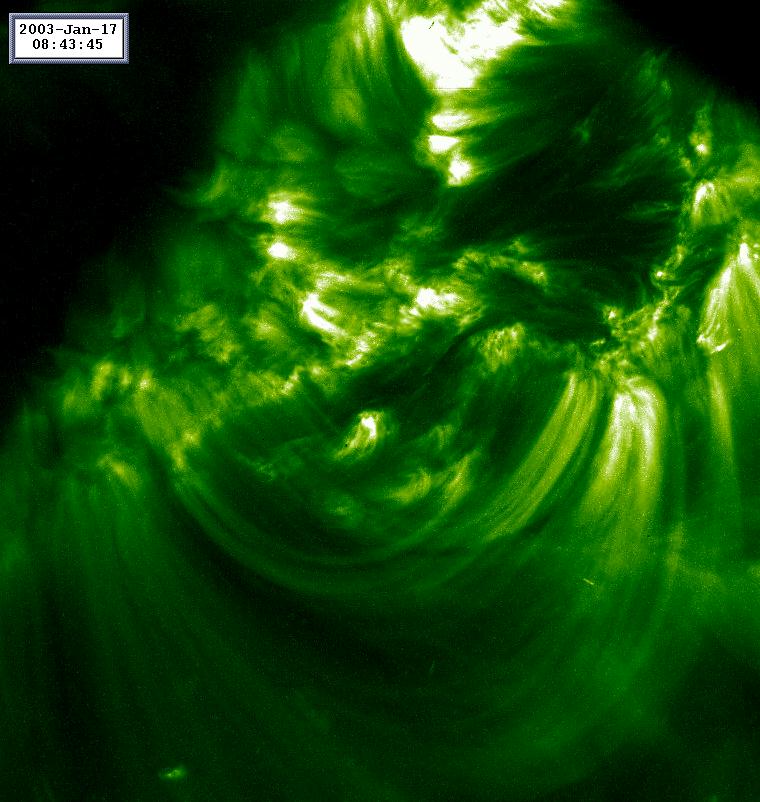 |
On 17 January 2003, TRACE observed these loops over Active Region
10251 (at 08:43 UT).
These loops were observed in the 195Å passband (most sensitive
to emission from gas at 1.5 million Kelvin) and spanned almost the
entire TRACE field of view of 380,000 km from side to side
(or 30 Earth diameters, or the distance from the Moon to the Earth).
Courtesy Dawn Myers.
|
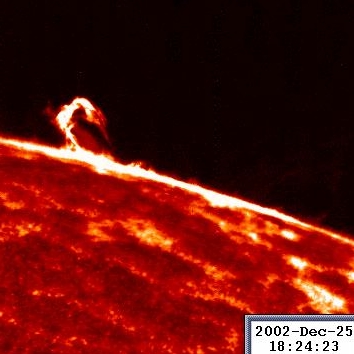 |
On Christmas Day, 2002, TRACE observed this eruption at the edge of
the solar disk, in the ultraviolet (1600Å channel). The
(QuickTime/JPEG; 3.7MB)
30-min negative movie
(from 18:11 UT to 18:31 UT) shows how the material is thrown up from
the solar surface, into the coronal loops, where it slides over the top
to fall back down to the surface on the other side of the loops.
The 450 frames in the movie are taken at a cadence of approximately 2.7
seconds, and still things move apparently very fast from frame to frame:
look at the phase between 18:17 UT and 18:22 UT, during which the material
whirls and twists as it moves upward, often in dense, bright (dark in this
negative movie) clumps. The overall speed with which material flows from
one end of the loop to the other is much lower, probably closer to 100 km/s,
or a ``mere'' 220,000 miles per hour.
Suggested by Dawn Myers.
|
 |
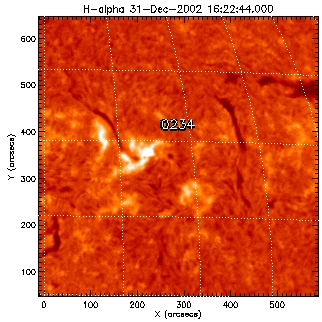
On 30 December 2002, TRACE observed a filament activation in Active
Region 10234, while observing in the 1600Å channel at an average cadence
of about 2.6 seconds. The (QuickTime/JPEG; 8.3MB)
movie in 1600Å
(from 16:47 UT to 17:05 UT) shows how rapidly the process evolves.
Sometimes streams of gas are seen at velocities of up to 500 km/s. The
ribbon on the left side forms almost simultaneously over its entire
length, possibly reflecting particles streaming along different field
lines from the flare site in the middle. This event probably corresponds
to a small B1.9 flare observed by GOES starting around 16:53 UT. The
location of the filament in H alpha can be seen on a
Big Bear image taken a day later.
|
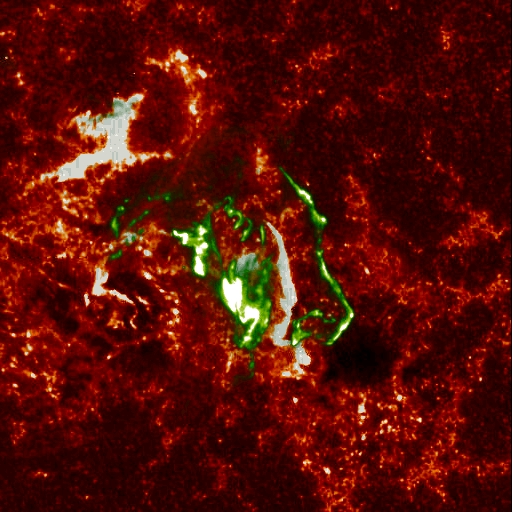 |
Remember this eruptive flare? This image is a blend of a 1600Å image
taken at 20:04 UT (green), with one taken later at 20:47 UT (red),
after the main eruptive phase subsided. In the center of the field
is (in green) what looks like a tightly wound coil. Perhaps we are
seeing the ejection of an electrical current embedded within the magnetic
field, which causes the field to wind around the axis of the ejected
material. Courtesy: Rich Nightingale.
|
 |
On 13 December 2002, TRACE observed a very thin loop in 171Å
(around 1 million degrees) in Active Region 10220. This strand, as thin
as the instrumental resolution allows, is visible for only about 11
minutes. Note that only one of the two footpoints glows very brightly,
despite the fact that loop modeling suggests that heating should be
conducted down both of the loop's legs. Is this a loop that is briefly
visible as it is heating up, or as it is cooling down? Unfortunately,
we cannot tell, because this structure was only observed in a single
wavelength.
|
 |
On 4 August 2002, TRACE observed a large flare at the limb.
The (QuickTime/JPEG; 3.4MB)
movie in 171&ARing;
(from 10:25 UT to 11:47UT; average frame rate of 1 per 8.7s) shows
the evolution of loop system: an increasing number of loops
appears in the 1 million degree range, probably as they cool from
higher temperatures that they reached during the main X-ray flare phase
(from 8:58 UT until 10:33 UT, according to the
NOAA listing). The material continues to cool, and dark, absorbing streams
of matter are seen to slide along the magnetic field, back towards the
surface of the Sun. Towards the end of the cooling phase, the multitude
of magnetic arches appears as a tangle, very different from the simple,
nearly parallel arcs that one would like to think dominate the solar corona.
TRACE observed this event at half resolution; the field of view is 160x160
arcsec; north has been rotated to the left.
|
 |
On 29 October 2002, TRACE captured a tangled filament eruption from
Active Region 10162, observed in the 195Å pass band (1.5 million
degrees in quiescence, but also much hotter gas during a flare). The
filament began to erupt around 03:00 UT, and within some 15 minutes
reached a height of more than 150,000 km, i.e. moving at a speed
exceeding 160 km/s. The eruption then stalled, and gas began to fall
down, as the tangled twist of the field continued. Unfortunately, TRACE
then missed a 30 min. interval, after which the high, bright field
had disappeared from view, and only a low, post-eruption arcade of
loops continued to glow.
|
 |
A busy day on the Sun: This
snapshot, taken by TRACE in its white-light channel on 31 July 2002,
shows three active regions close together: ARs 10039, 10044, and 10050.
The clusters of sunspots together cover over 1.5% of the visible
solar surface.
The field of view is 880 by 700 pixels of 375 square kilometers each.
|
 |
On 4 August 2002, TRACE observed these evolving loops in their post-flare,
cooling phase (probably following an M6.6 flare that started at 9UT).
The (QuickTime/JPEG; 15MB)
movie in 171Å
(10:31 - 11:47 UT on 4 August 2002) shows the evolution of these loops
at an unusually high cadence of 7.5 seconds; this was achieved by
summing the relatively weak signals on the camera in bins of 2x2 pixels,
thereby making it strong enough not to affected much by the background noise.
The loops are seen to brighten as the cool from several million degrees
to around 1 million degrees where TRACE can observe them in the
171Å channel. From the very beginning, material can seen to be
draining from these loops, falling back to the surface from where the
material was originally ``evaporated'' by the energy released during the
large flare. Courtesy Dawn Myers.
|
|
| Home | Mission | Instrument | Team | Operations | Results | Images | Movies | Education | Site Info. | |