

The TRACE images may be used without restrictions
in publications of any kind. We
appreciate an acknowledgement indicating that
the Transition Region and Coronal Explorer, TRACE,
is a mission of the Stanford-Lockheed Institute for Space
Research, and part of the NASA Small Explorer program. More information on
TRACE and other TRACE images can be found
here.
 |
On 28 May 2003, TRACE observed an X1.3 flare in Active Region 10365, in
the ultraviolet channel 1600Å. The (QuickTime/JPEG; 1.5MB)
false-color movie in 1600Å
(from 2003 May 27 22:51UT to 23:44UT) shows the very bright flare core
(on a logarithmic scale, saturating at the detector limit of 4095DN),
with the spreading flare ribbons and the lift-off of a set of coronal
loops. Note the very narrow flare ribbon running through the the umbral
region of one of the spots in the region, e.g. at 23:10:03 UT.
|
 |
This composite shows the transit of Mercury (4800 km diameter)
across the solar disk,
as observed by TRACE in its 1600Å pass band on 7 May 2003. The
composite shows the position of Mercury roughly every 450 seconds.
The wobble on the disk crossing is a parallax effect caused by the
orbital motion of TRACE around the Earth; this wobble could - if we
didn't know it already - be used to determine the distance of Mercury
to the Sun! Notice, by the way, that Mercury moves up and down as well
as left to right during the TRACE orbit, modulating the spacing of the
disks in this composite image. The transit
can also be seen in this (AVI/cinepack)
movie.
For more TRACE movies and other links to Mercury-transit observations,
click here.
SOHO observations can be seen
here;
notice there's no wobble there, because SOHO does not orbit the Earth!
|
 |
On 31 May 2003, TRACE took this image showing the moon
moving in front of the Sun. TRACE saw the Moon move
across the Sun several times in a row, owing to the fact that it
is orbiting the Earth, which changes the lineup of the telescope,
Moon, and Sun. In
this image, taken at 05:22 UT, the Moon obscures the upper left segment
of the image (the black corners of the image are caused by vignetting
by a filter within the TRACE telescope).
|
 |
TRACE observed this M1.0 flare in its 195Å passband on 2 May
2003. The flare, seen in this (QuickTime/JPEG; 8.2MB)
movie in 195Å,
started in the GOES hard X-ray data at 02:47 UT, but just before it,
what looks like an emerging ephemeral region (seen to the NE of the
main flare) erupted in what may have been a related event. Note how
the field in the main flare, as outlined by both hot (bright) and
cool (absorbing) material around the dark filament, rises, twists, and
appears to restructure its connections.
|
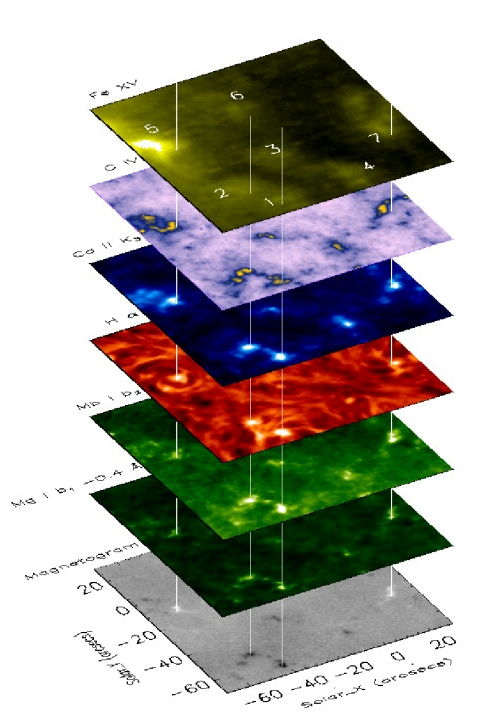 |
Combination of observations from observatories from around the Earth and
above it enables us to probe the Sun's atmosphere more or less layer
by layer. This diagram shows, from bottom to top,
(1) a magnetic map (NSO Sacramento Peak),
(2) Mg I b1 - 0.4Å (NSO Sacramento Peak),
(3) Mg I b2 (NSO Sacramento Peak),
(4) H alpha (NSO Sacramento Peak),
(5) Ca II K3 H core (NSO Sacramento Peak),
(6) C IV 1600Å (TRACE),
(7) Fe XV 284Å (SOHO/EIT).
With such images, we can probe the propagation of waves into the solar
atmosphere, and use them to learn about the physical processes that occur
there. This image was taken
from a paper by McAteer et al. (2003; ApJ 587, 806) that
focused on understanding the transformation of one type of wave into
another en route from the solar surface (at several thousand
degrees) to the solar corona (at several million degrees).
|
 |
TRACE tracked Active Regions
10278 and 10282 as they rotated away over the western edge of the Sun. As
they did, they let out one more small eruption. This eruption was
observed in 195Å, shown in this (QuickTime/JPEG; 4.6MB)
movie. Notice the
winding motions, which likely indicate that electrical currents
are evolving within these magnetic loop systems. Courtesy: Dawn Myers.
|
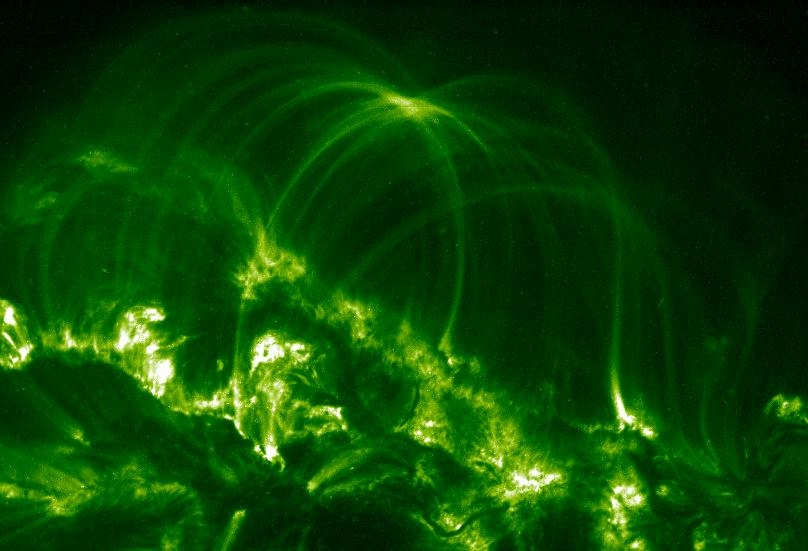 |
In the aftermath of an M1.5 flare in Active Region 10162 (starting at
17:23 UT, on 25 October 2002), TRACE observed this set of cooling loops
at 4:00 UT on 26 October 2002, in the 195Å (1.5 MK) pass band.
In projection, the cooling loops appear to form a spider hovering
over the region. There is (most likely) no real intersection of
these loops in the corona: the cause is simply that the corona is essentially
transparent, so that when many loops coincide at a give line of sight,
their emission adds up to much more than the brightness of the individual
loops. Courtesy Zoe Frank.
|
 |
A very small flare (microflare) was observed jointly by TRACE (195Å)
and RHESSI on 06 May 2002. Although this flare was not large in
spatial extent or in total energy, it nevertheless shows many aspects
seen in much larger events. The flare initially brightened in two
footpoints separated by 25 arcseconds. A few minutes later, we see a
post-flare loop brightening in the TRACE 195Å image (shown in the
image). The RHESSI hard X-ray images from the initial phase of the
event are superimposed as red and blue contours. The blue contours
show soft X-rays in the 3-8 keV range and the red contours show harder
X-rays in the 8-15 keV range. Interestingly, the RHESSI footpoints in
the 8-15 keV energy range do not appear to line up with the TRACE 195
footpoints. The uncertainty in the TRACE pointing for this event
(estimated to be about 3 to 5 arcseconds) may account for some of the
misalignment, but the scale of the two images is quite precise, so
there is no way to make both RHESSI footpoints match the TRACE
footpoints. Perhaps the RHESSI image is showing hot plasma above the
TRACE loop. Fitting a thermal spectrum to the RHESSI data gives a
temperature estimate of 13 million degrees with a small emission
measure of 5 10^46 cm^-3. Courtesy Tom Metcalf (LM/ATC).
See: "Hard X-ray Microflares Down to 3 keV", Krucker, S., Christe, S., Lin,
R. P., Hurford, G. J., and Schwartz, R. A. 2002, Solar Phys., 210, 445.
|
 |
 On 27 February 2003, TRACE observed a very quiet area at the center of the solar disk in its 171Å filter (1 million degrees). The area was so dim, that the exposure times went up to 155 seconds, revealing weakly emitting structures that we rarely get to see well, with even darker ones embedded. The high-pass filtered, higer contrast image to the left shows field structures that are unusual: particularly towards the upper left corner, the dark structures outline what looks like a fern leaf lying on the solar surface. Big, though: the field of view is 370,000 km to a side, or 29 Earth diameters. |
 |
Now that, in early February of 2003, TRACE is coming out of
its 5th eclipse season, normal operations are resuming, and
the weekly updates of this image collection will also. Today (12 Feb. 2003)
we feature a paper model of the TRACE satellite, designed and
made available to
us by Erik te Groen, a member of the Dutch Observatory club
Philippus Lansbergen, with help from Jeff Parker (GSFC).
The model and the instructions can be found in
this pdf file.
TRACE is still doing fine, with little degradation from the state it
was in when launched.
Since its launch on 2 April 1998, it has obtained close to 6 million
images of the Sun, from its surface to the high corona.
|
|
| Home | Mission | Instrument | Team | Operations | Results | Images | Movies | Education | Site Info. | |