

The TRACE images may be used without restrictions
in publications of any kind. We
appreciate an acknowledgement indicating that
the Transition Region and Coronal Explorer, TRACE,
is a mission of the Stanford-Lockheed Institute for Space
Research, and part of the NASA Small Explorer program. More information on
TRACE and other TRACE images can be found
here.
 |
Flux emergence and reconnectionTRACE observed the evolution of Active Region 10455 during its disk passage in September 2003. This (QuickTime/JPEG; 19.4MB) movie in 171Å shows the evolution during an 11-day period (Sept. 5 through 16), showing exposures taken roughly half an hour apart (the TRACE data base contains the full set at a cadence of under one minute). The movie shows the response of the corona to the emergence of new bipolar regions in two very different situations:Around midday on September 10, a new bipolar region emerges just right of the center of the field of view, underneath the dark filament. Within hours of this emergence, the filament destabilizes and rearranges its endpoints (only one of which is seen in this cutout). By 19UT on 11 Sep., the filament disappears, and a weak (B7.9) flare follows: faint flare ribbons are briefly seen, followed by brightening loops early on 12 Sept. that show a peculiar kink before straightening out. But filaments are not easily defeated: fragments of it reform, and a faint darkening is seen where the original filament was as the region approaches the Sun's western limb. Around 10UT on 12 September a new bipolar region emerges to the
left of the center of the field of view. As it expands into the corona,
new connections to the pre-existing field to the left/west are seen
within some 9 hours after the emergence starts, shortly thereafter
followed by connections to the south and then to the north-east.
|
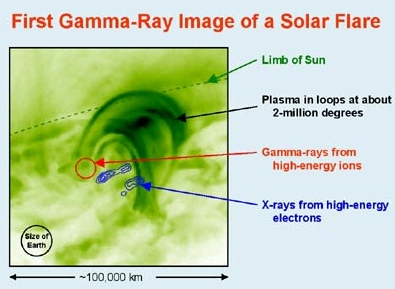 |
A superposition of a RHESSI image of gamma-ray and X-ray emissions (contours)
with
the TRACE satellite extreme ultraviolet image (green, negative color
table) taken 90 minutes later of
the July 23, 2002, solar flare. The superposition clearly shows the
large separation between the high-energy emissions. Solar physicists
expected to see X-rays and gamma rays emerging from the same spots at
the base of the flare loops.
Apparently, the Sun's magnetic processes are able to separate the electrons
from the ions, sorting them either by mass or electric charge, as they blast
them to almost the speed of light. The gamma rays seem to be coming from
the feet of the large magnetic field loops, while the X-rays come from the feet
of the small magnetic loops nested inside the larger ones.
See the press release for the full story, at
Berkeley,
GSFC, or
NASA.
|
 |
Revisiting a flare: the X4.8 flare that TRACE observed
on 23 July 2002 was featured on these TRACE pages
once before, but it turns
out to be worth looking again. The (QuickTime/JPEG; 6.9MB)
movie in 195Å
shown here shows the flare at
a very much reduced contrast (and flipped left to right),
and with a much higher saturation threshold.
Consequently, it shows the brightest flare ribbons and loops, rather than
the surroudings of the flare that were visible in the
other movie.
What shows up at this scaling of the images that we did not see
before is a fuzzy, relatively faint emission above the flare arcade
in which there are rapid downward motions. We have seen this only
once before, namely above the
X1.5 flare on 21 April 2002.
SOHO observations of that flare suggested that these dark regions are,
in fact, voids that move downward, likely as a consequence of the
reconnection that occurs in the wake of the eruption. But other than
that, we still do not know what we are witnessing: this second event
with this phenomenon may shed more light on that.
Movie by Dawn Myers. |
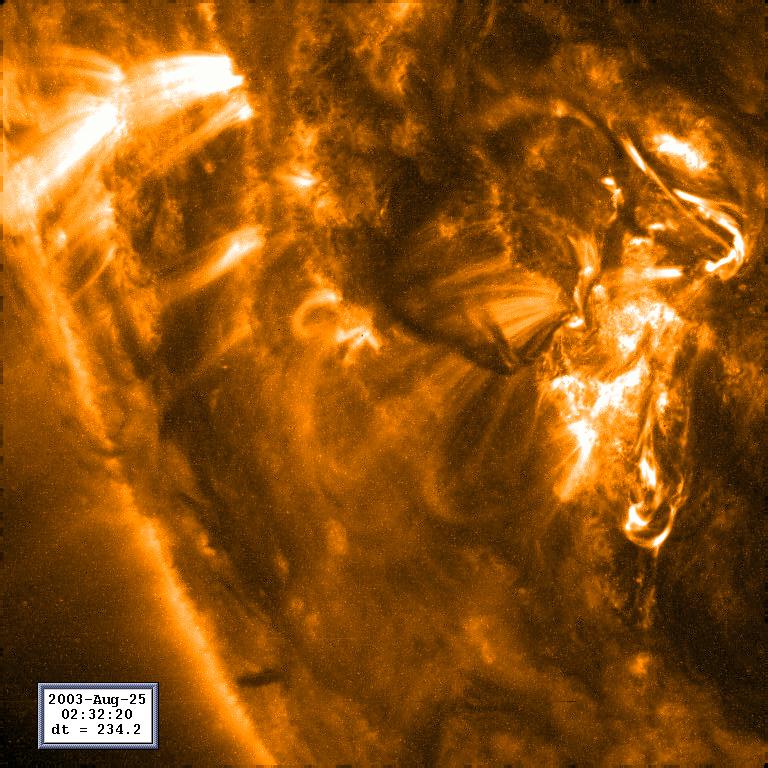 |
On 25 August 2003, TRACE observed a filament eruption in Active Region
10442. The (QuickTime; 5.7MB)
movie in 171Å shows
the initial, slow rise of the filament for about half an hour from
the start of the movie at 02 UT. The eruption then becomes
explosive between 02:28 and 02:32 UT. Within that interval,
NOAA logged a GOES C3.6 flare in the region. Notice that the
high filament material can be traced into the upper-left corner until
at least 02:46 UT, where it casts a faint shadow onto the bright loops
behind it. Courtesy: Dawn Myers.
|
 |
On 18 August 2003, around 09 UT, TRACE observed a small flare in Active Region 10431, using its 171Å pass band. The initial phases of the flare, shown in the four panels above, show a strong brightening of parts of a ring, forming the footpoints low above the solar surface of loops that are too hot for TRACE to observe. The magnetic field (shown on the left, with approximate positions and scale only), reveals why this flare occured with this particular geometry: a white-polarity intrusion exists within an otherwise black polarity area. This creates an ``anemone''-shaped ring of loops that end on the bright ring seen by TRACE. The magnetic topology is likely to have a null point floating in the corona above the center of the white-polarity intrusion (much like the configuration shown here); the central brightening may reveal that null point, or may lie low in the corona at the base of the flaring loops that are too hot for TRACE to observe. This event was pointed out by Sam Freeland, who also made a JAVA-script movie that can be seen here |
 |
As active regions emerge onto the surface of the Sun, much of their
magnetic field organizes into sunspots and their smaller relatives, the pores.
This process can be very complicated, particularly if flux emerges into
an alread existing active region. This (QuickTime/JPEG; 4.6MB)
movie in white light shows
five days in the life of Active Region 10030, with approximately one
frame every hour (the movie runs
from 2002 July 12 19:00UT to July 17 18:44UT). Note that TRACE tracks the
region as it moves across the solar disk, so that the center of the image
is always near the center of the active region; this leaves the distortion
of the region as it is seen at different locations on the solar sphere,
however, resulting - for example - in the apparent motion of the trailing
(left) sunspot. Note also that the leading polarity of the new region
merges with the existing sunspots, whereas the trailing polarity forms
its own sunspot even as the existing one almost entirely disappears
within the five-day interval that is shown here.
|
 |
TRACE not only sees hot material in the corona, but often also relatively
cool material at temperatures that are over a hundred times lower than those of
the hot corona. This cool gas absorbs the EUV emission from the hot gas.
It often shows up in the form of coronal rain, with loops draining after
the heating stops. We also often see so-called sprays or surges: cool gas
is thrust upward from the chromosphere into the corona, where it either
heats up or falls back down. This (QuickTime/JPEG; 3.2MB)
movie in 284Å shows
a series of such surges near the solar limb that were observed
on 21 August 2001.
|
 |
Sunspots evolve gradually on a time scale of many hours. That makes
it hard to observe from the ground, with nights and periods of bad
weather interrupting observations. It is easier from TRACE, for which
interruptions only occur because something else of interest happens
on the Sun and the telescope is pointed elsewhere for a while. This
(QuickTime/JPEG; 11.7MB)
movie in white light
shows the evolution of the spot group in Active Region 9715,
as observed from 0 UT on November 28, 2001, through 5 UT on December 6, 2001.
This 9-day period (shown with typically 10 min. between frames,
except for data dropouts and radiation-`damaged' frames) shows emerging
flux, coalescing into a large, leading sunspot, and trailing smaller ones.
By the time the region reaches the western limb of the Sun, most of
the small spots and pores have vanished, leaving only the large, now
apparently monolithic, leading sunspot.
|
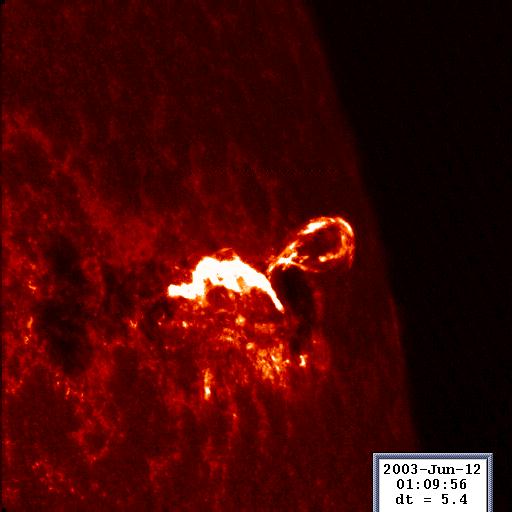 |
TRACE observed an M7.3 flare in AR10375 on 12 June 2003, starting
around 01:04 UT. This (QuickTime/JPEG; 10.MB)
movie in 1600Å shows the
development of the flare in the ultraviolet, at an average cadence of
5 seconds between frames. As the movie starts, a twisted loop emerges
from the region, twisting and draining as it rises. Then, only some
six minutes later, a second, smaller such loop is seen to rise. Following
these events, we see the bright 'flare ribbons' evolve smoothly, flickering
only because the exposure times change from frame to frame, leaving
a small ripple on the movie signal. Courtesy Dawn Myers.
|
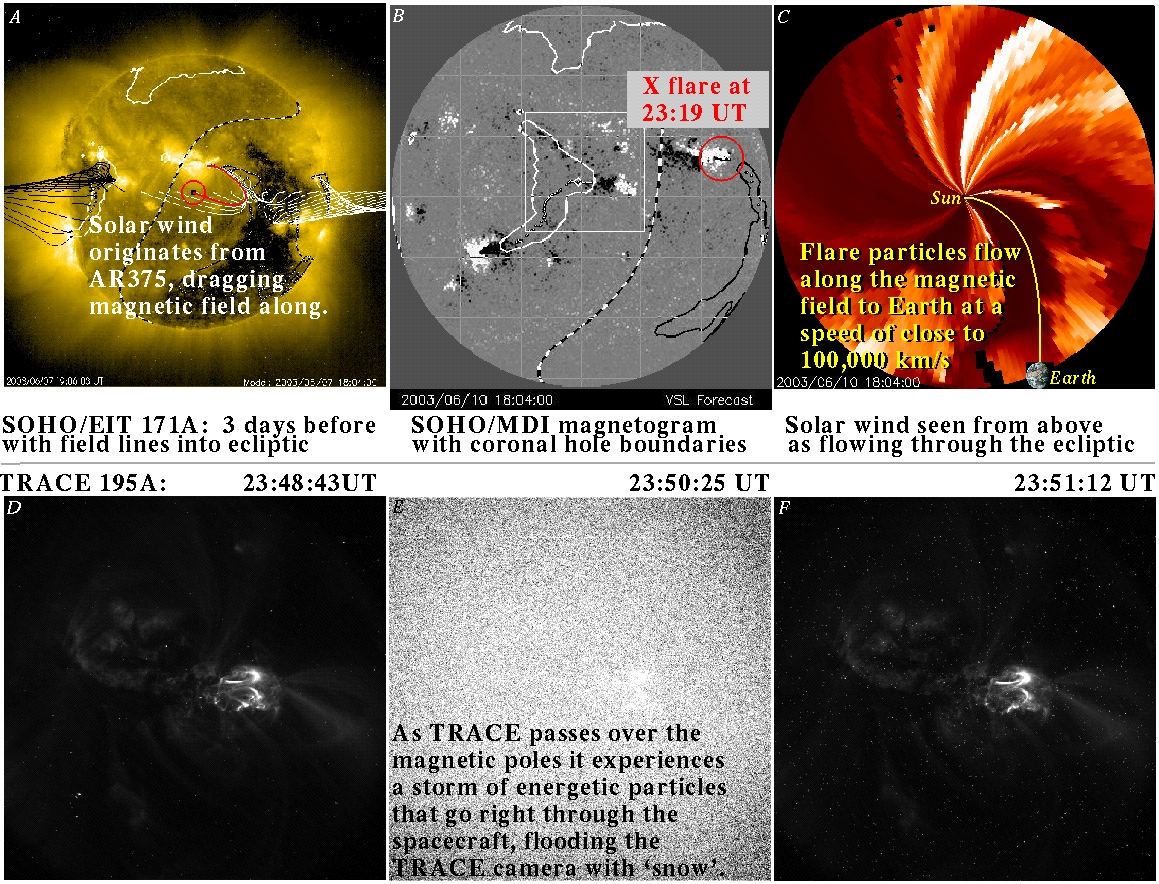 |
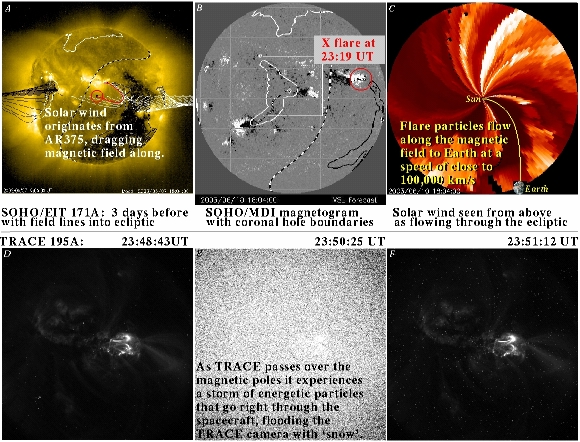
The Sun-Earth connection?Active Region 10375 flared again: at 23:19 UT on 10 June 2003, an X1.3 flare was observed by TRACE in its 195Å passband. During these observations, the TRACE camera was hit by a storm of dangerous, high-energy particles (only a dozen other 195Å images have been recorded in the past three years that are that badly affected out of a total of 121,000). Did these particles originate from the solar flare? If so, how did the particles get here?The possible connection, shown in the large image (smaller version here), may have started three days before the flare. At that time, our models of the solar coronal field (shown in panel A) showed that the solar wind leaving the Sun in the direction of the Earth was originated in the magnetic field of AR10375 (the red line traces the field from the region into the heliosphere). That wind flowed towards the Earth with a speed of order 500 km/s, taking more than three days to reach the Earth, and pulling a thread of magnetic field from AR10375 directly to Earth. When the flare went off, the Sun had rotated quite a bit, with AR10375 approaching the edge of the Sun (panel B). Any flare particles that reached into the open field would have flowed along the field pulled by the solar wind (see the top view in panel C). What did TRACE see? Did the particle storm reach Earth just as TRACE flew over the Earth's magnetic pole, so that it was exposed to the storm without the protection of the Earth's magnetic field some 30 minutes after the flare as particles moving at about 1/3rd the speed of light went through the spacecraft, detector and all? Or is it merely a coincidence in which TRACE saw unusually many particles from within the Earth's magnetosphere fortuitously just after a major solar flare? Energetic particle sensors around Earth didn't see what TRACE saw: GOES 12 did see something in its electron flux measurements, but not particularly strong, and GOES 10 saw nothing - but then, these satellites are within the Earth's magnetic region, over the equator. ACE also did not see an energetic-particle event - but it is a million miles from Earth. Finding out what really caused the TRACE `snow' continues ... (The model used to connect the Sun to
the Earth is described on our space-weather forecast
pages).
|
 |
Active Region 10375 flared repeatedly:
this (QuickTime/JPEG; 4.8MB)
movie in 195Å
shows a 1h 45m movie of the activity shows two C3 flares and an M2
flare (starting around 02:48 UT).
TRACE observed interesting
phenomena in this region even outside the big flares, however.
Notice, for example, the repeated jets coming out from this region's
leading (western) edge, moving towards the west and south-west. Some
of these jets (visible as streaks blurred within the ~20-30s exposures)
land near the region, others move along the field outside the field
of view (of 640x480 pixels of 375km each). Notice also the oscillatory
motions in the western(left)-most active region loops, bringing
the total to at least 27 cases (
list of events).
|
|
| Home | Mission | Instrument | Team | Operations | Results | Images | Movies | Education | Site Info. | |