

The TRACE images may be used without restrictions
in publications of any kind. We
appreciate an acknowledgement indicating that
the Transition Region and Coronal Explorer, TRACE,
is a mission of the Stanford-Lockheed Institute for Space
Research, and part of the NASA Small Explorer program. More information on
TRACE and other TRACE images can be found
here.
 |
On 8 June 2004, TRACE observed the transit of Venus across the disk of the Sun. Follow this link to a website that describes the event and will show TRACE observations as soon as the data are available in our archives. |
 |
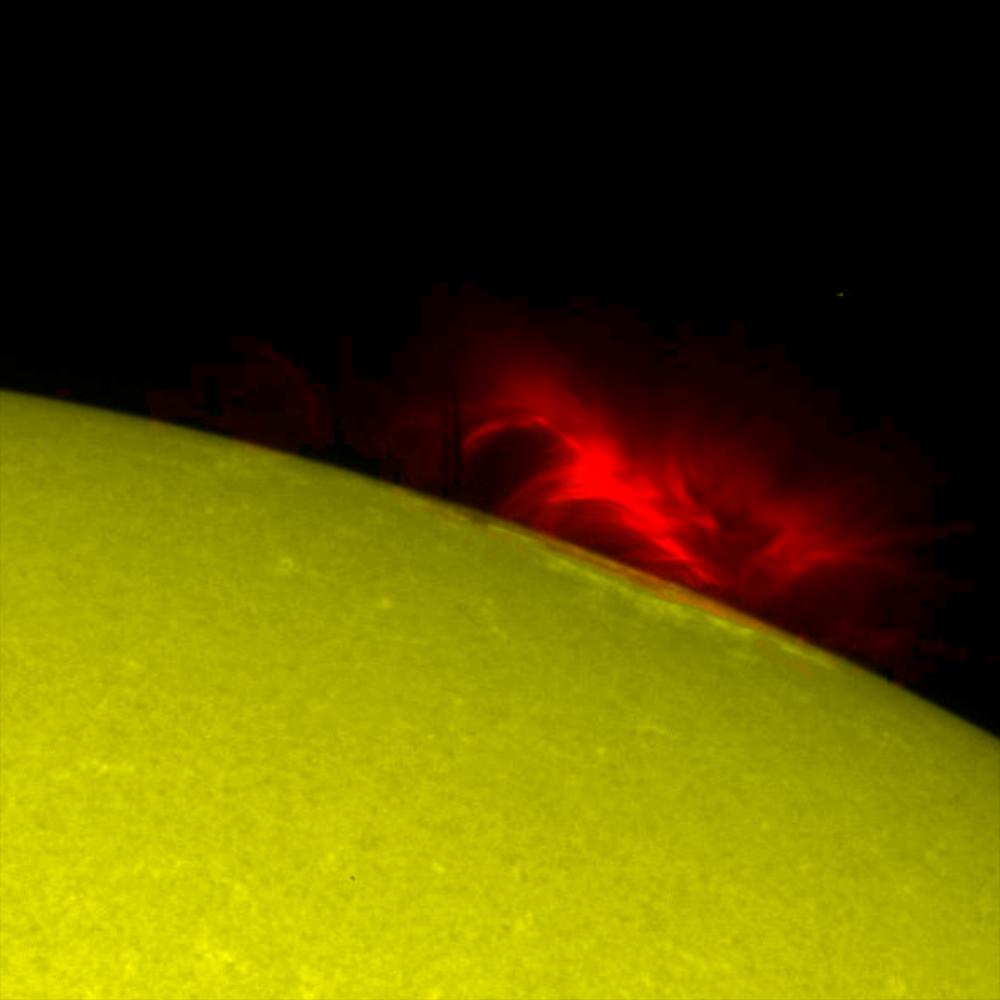
Anything that is not a strong, large bipolar active region is called
'quiet Sun.' With TRACE, however, nothing there is particularly quiet.
The (QuickTime/JPEG; 13MB)
movie in 171Å shows
3 1/2 hours of quiet Sun. The region (outlined in the magnetogram taken
by SOHO/MDI to the left - click for a full-disk version) contains
enhanced network in which bright and dark structures evolve from moment to
moment. To the north and east (left) there are filament-like structures,
showing flows and rearrangements, and 'feathers' of fibrils presumably
landing on the mixed polarity network. It is surprising how little
of these filaments shows up on the
H alpha image
taken at
Big Bear Solar Observatory that day.
|
 |
Neighboring Active Regions 10581 and 10582 did not flare spectacularly,
but this sequence of small flares (C1.1, B6.4, C2.0, C3.8) is interesting,
nevertheless.
The (QuickTime/JPEG; 13MB)
movie in 195Å shows
the evolution from 21 UT on 30 March 2004 until 03 UT the next morning;
the pixels are twice as large as normal (here 725 km to a side). The weakest
of these flares is, in fact, the most intriguing event. Starting at 22:45 UT,
the southern region undergoes a filament destabilization: rolling motions
are followed by brightening of the filament structure, and then
the brightening turns into flare ribbons that spread out. Simultaneously,
the outer loops move, as if they were opened by an erupting structure. Then
a set of cooling post-eruption loops brightens across the filament, suggestive
of reconnection. During this process, another event (C3.8) occurs
in the northern region.
These events were suggested for this POD by Alana Sette,
SAO.
|
  |
In the course of time, the
TRACE detector showed an increasing number of 'warm pixels' with
increased background levels. To counteract that effect, the TRACE team
warmed up the detector for three days, from 17 through 19 of March,
2004, from the usual operating temperature of some 60 degrees
Centigrade below freezing to 40 degrees above.
We found that the number of 'warm' pixels had decreased by about
a factor of three. |
|
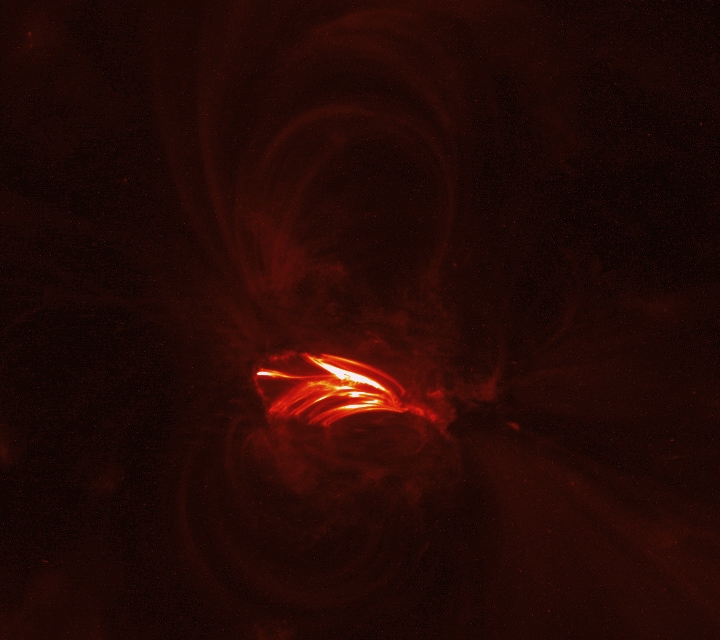
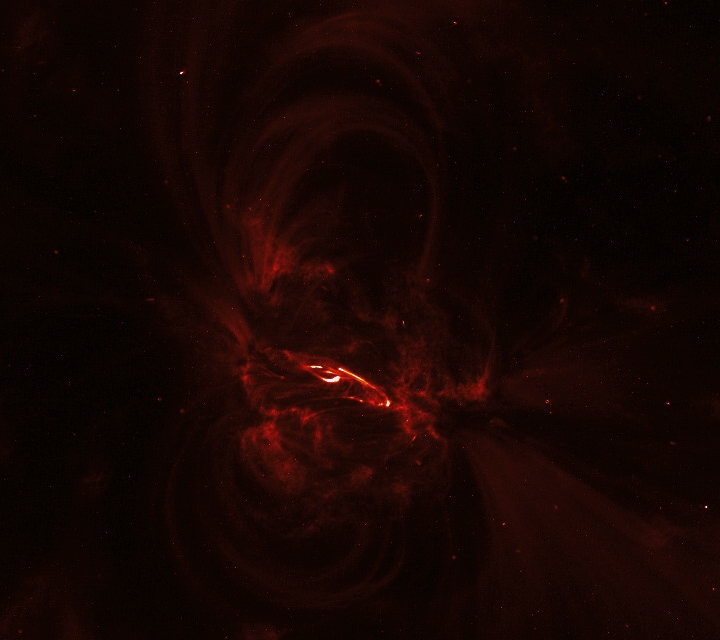
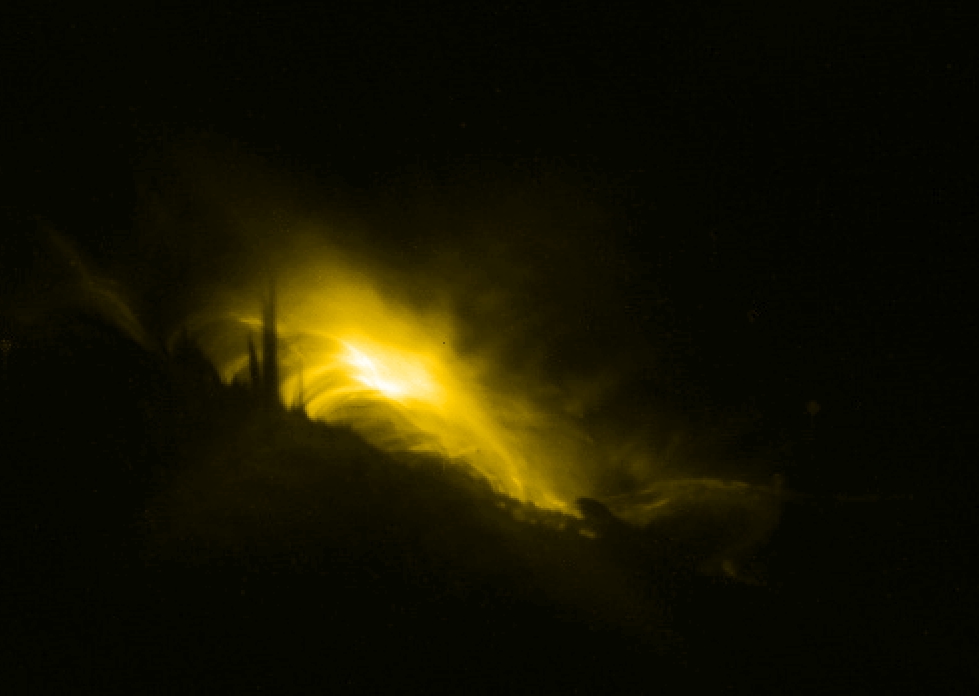
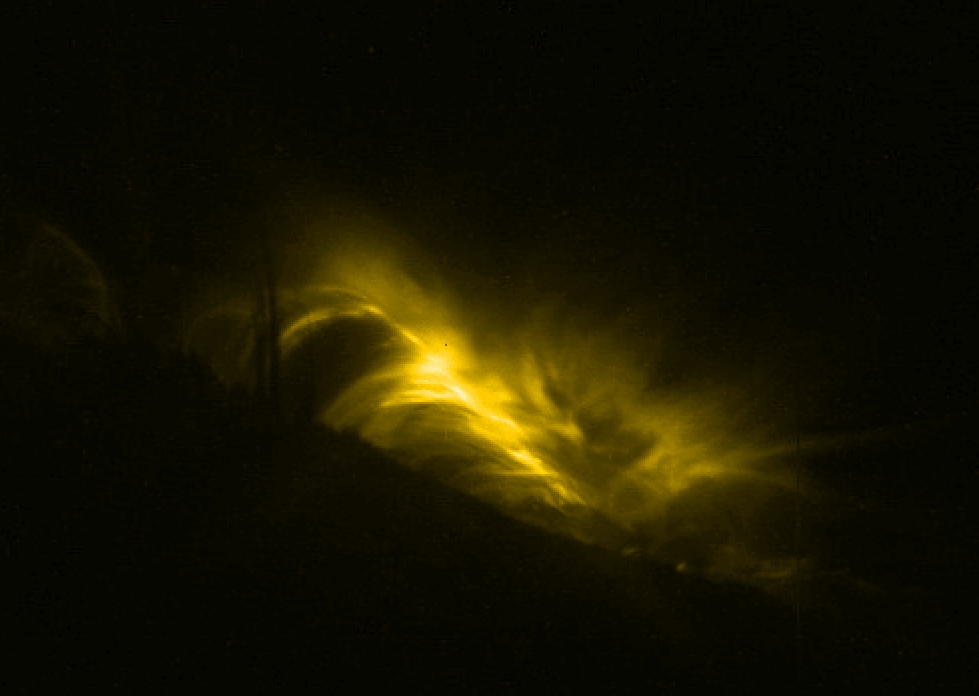
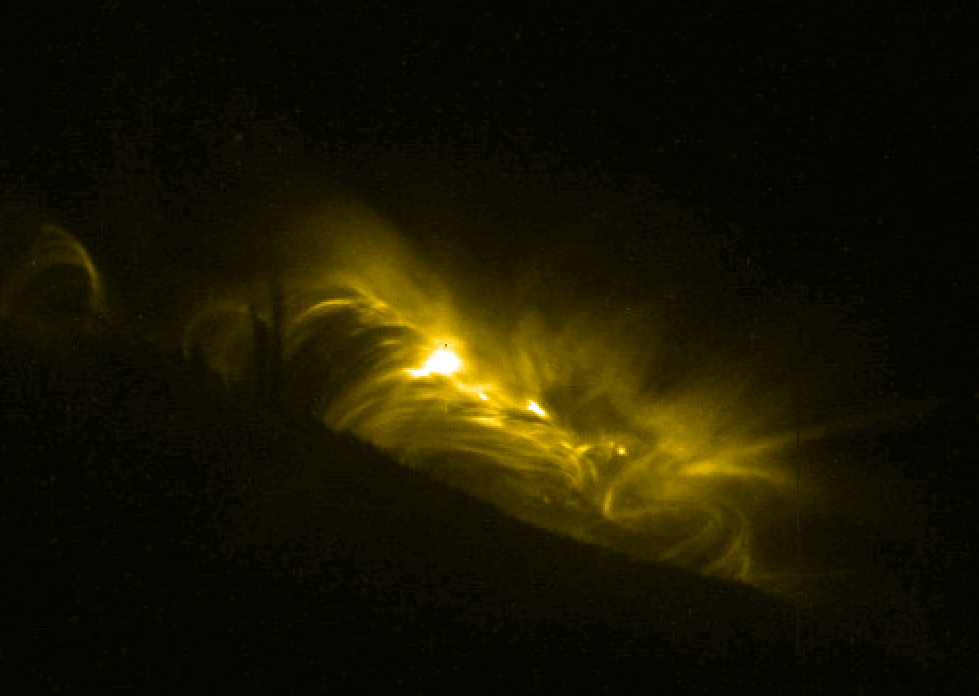
On 26 February 2004, TRACE observed an X1.1 flare in Active Region
10564. The images above show pre-flare and post-flare conditions,
having been taken at 01:41 UT and 02:17 UT, respectively, with
the flare peaking at 02:03 UT. The (QuickTime/JPEG; 5MB)
movie in 171Å shows the
evolution of the loop structures at the flare site. The exposure durations
are 23 seconds in all frames, but the display scale is changed once the
flare starts so that the flare loops do not saturate in the movie.
Images and movie courtesy of Dick Shine and Zoe Frank.
|
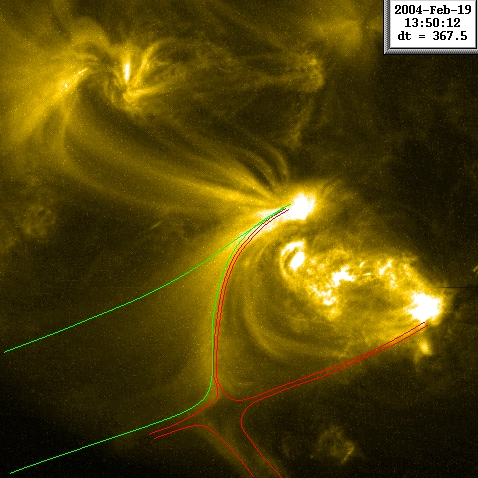 |
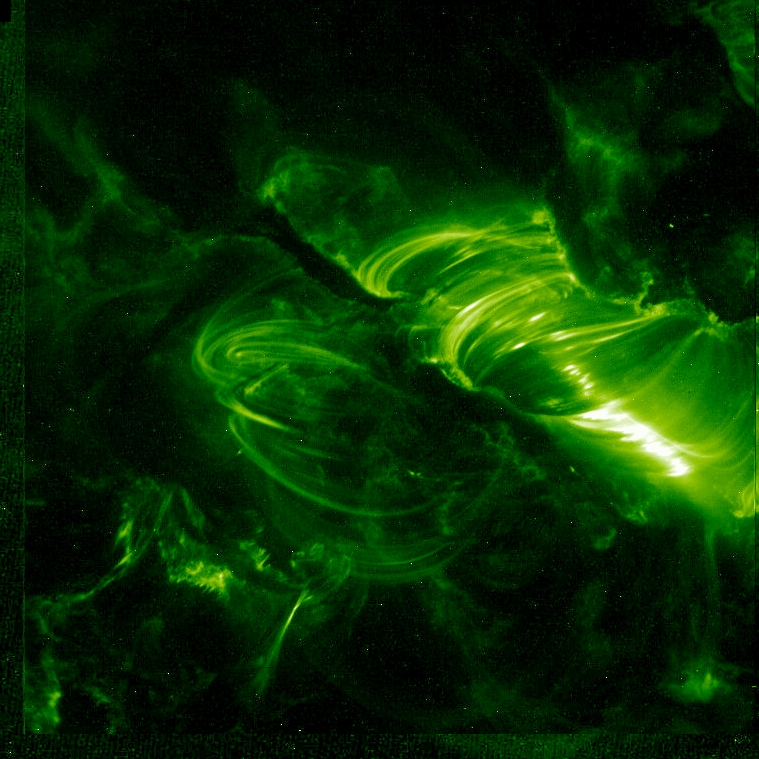
The interaction of neighboring magnetically
active regions causes the solar corona to reconfigure its connections
all the time. Although it must be a common process, we do not often
get a chance to see how it really happens. This
movie in 171Å of
Active Region 10561 and surroundings shows us a glimpse of this
process, we think.
The movie suggests the existence of an X-point in the magnetic
field (near the center at the bottom of the field of view, which
spans 10,000 km to a side). As time progresses, a new set
of loops appears (outlined in green in the still image to the left),
startin around 8 UT. This set of loops may well be field that
originally closed within the magnetic region, closer to the
solar surface than the location of the X point. That field then
appears to migrate through the X point, now connecting to fields
much further away.
|
|
 : largest soft X-ray flare observed to date. : largest soft X-ray flare observed to date.The (QuickTime/JPEG; 7MB)
movie in 195Å shows
the evolution of the flare, seen at the solar limb (images rotated by
+90 degrees). Another (QuickTime/JPEG; 8.4MB)
movie
shows the evolution in the 1600Å channel (same orientation,
but not aligned; movie by Zoe Frank, LMSAL).
The two images to the left show the cooling arcade after the flare
in 195Å (top) and an overlay of the white-light image (in yellow)
and the flare as seen in 195Å. Here are a few
snapshots taken at
19:53:40,
20:08:51, and
20:12:39.
|
|
: third largest recorded until then (but see the entry above!). The (QuickTime/JPEG; 17.4MB) 3-hr movie in 195Å shows the evolution of the flare: It begins with some compact loops in the center of the field just after 10 UT. That is followed within 15 minutes by several flare ribbons that brighten, and rapid motions and brightenings around the filament towards the lower right. The beginning of the main event complex occurs just as TRACE cannot observe for about 25 minutes; when observing resumes, there is a fuzzy set of loops just left of center. Around 11 UT, many new flare ribbons right of center show up (so bright there are multiple diffraction patterns seen in the images). Again there is an interruption in the TRACE observations: 12 minutes later, a bright post-flare arcade is formed, that cools and drains with time. During that last phase, there is one more period when TRACE cannot observe, because the Earth moves in front of the Sun; the fainter images that beautifully show the cooling arcade when observing resumes, are observed through the Earth's atmosphere. As TRACE moves away from its eclipsed views, the loops brighten again as the Earth's atmosphere blocks less and less of the light. Click
here to access the NASA press release,
here for the ESA press release,
here for the frames from above TRACE movie,
or use these for two other movies:
movie in 195Å (13.7MB),
movie in 1600Å (13.8MB).
|
 |
On 27 May 2003, an X1.3 flare started around 22:56 UT, according to the
NOAA event listings.
This flare occured in an unusual magnetic configuration (see the high-resolution magnetogram
somewhat earlier here):
black polarity field wedged between two white-polarity ridges. The
flare was associated with a field eruption around 23:00 UT, which TRACE
observed in its 1600Å passband. EUV observations of the region did
not start until about 00:40 UT on 28 May; one of the first of these
images is shown to the right. It reveals a double arcade of loops, cooling
and draining after the flare: the coronal magnetic field shows a double
arcade structure, with a well-defined magnetic separatrix running in
between, apparently not far from a potential-field state.
Note that this separator is also visible in the earlier
EIT 284Å
image.
|
 |
The so-called quiet Sun has not received much attention in this
collection of TRACE imagery ... yet. But here is an example that
illustrates the complexity of these regions that cover most of
the solar surface: this (QuickTime/JPEG; 1.0MB)
movie in 171Å shows
the evolution of a region of very quiet Sun that was observed on
4 May 1998, early in the TRACE mission. These deep exposures (with
exposure times ranging from 46 to 131 seconds) summarize the evolution
of the multitude of coronal loops that exist between the magnetic
concentrations that cover the quiet regions of the Sun over a period of
just over 5 hours. The long exposures often have radiation hits in them
that degrade the images, despite the application of a correction
algorithm (the worst frames were deleted altogether). The movie
illustrates just how complex the quiet Sun really is, and how frequent
the many interactions between them change shape (a
detailed study
showed that the coronal pattern over quiet Sun in fact decorrelates
completely on a time scale of no more than 15 hours).
For examples of another quiet-Sun region, with magnetic information
overlaid,
click here,
and scroll to the bottom of the main frame.
|
|
| Home | Mission | Instrument | Team | Operations | Results | Images | Movies | Education | Site Info. | |