

The TRACE images may be used without restrictions
in publications of any kind. We
appreciate an acknowledgement indicating that
the Transition Region and Coronal Explorer, TRACE,
is a mission of the Stanford-Lockheed Institute for Space
Research, and part of the NASA Small Explorer program. More information on
TRACE and other TRACE images can be found
here.
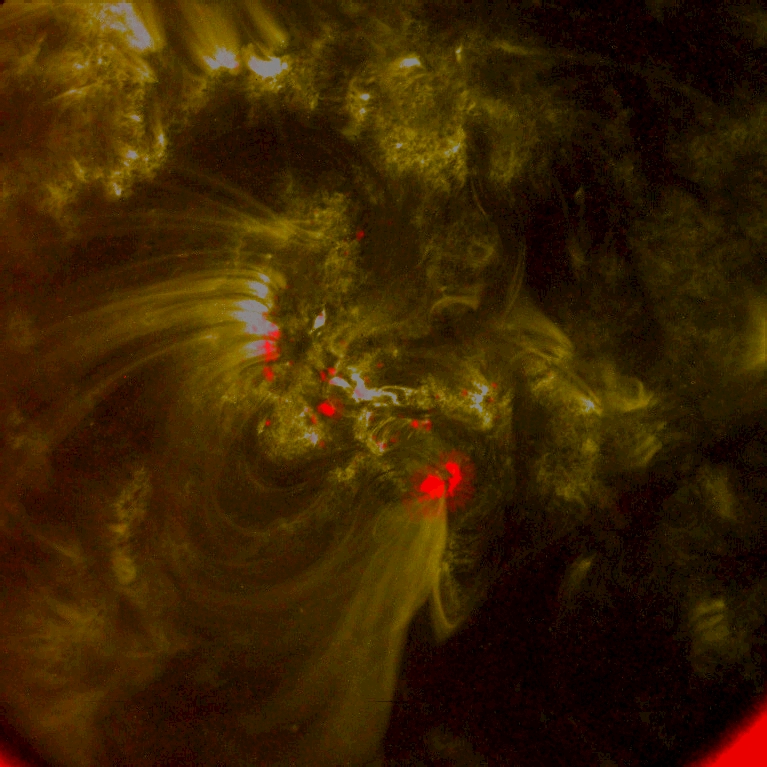 |
This image is a blend of a 171Å image (yellow) and a negative
white-light image (red) taken on 2004 September 13, at 2:11 UT.
The blended image shows that many of the bright
loops seen in the 171Å channel within the active region emanate
from strong field concentrations that form spots and pores within the
magnetically active region. The leading large spot, towards the
lower right of the cluster, illustrates that the 171Å-bright loops
emanate from light bridges rather than from the strong-field, dark
regions of the spot umbra.
|
 |
On 31 August 2004, an M1.4 occurred in AR10663 on the western
limb of the Sun. This movie
(QuickTime/JPEG, 4.4MB;
MPEG, 3.7MB)
in 195Å (rotated 90 degrees counterclockwise)
shows the associated filament eruption and the cooling
arcade that forms in its wake. Movie courtesy Dick Shine (LMSAL).
|
 |
A magnetic dome in the aftermath of a flare?In the hours after the X1.8 flare at 17:29UT in AR10656 series of post-flare loops are seen to drain over the solar limb. This (QuickTime/JPEG; 5.6MB) movie in 195Å shows this for a 2hr interval from 19:48 UT to 21:31 UT (rotated 90 degrees counter clockwise). One part of this movie that is particularly interested is the interval from about 20:50 UT to 21:20 UT: notice how the relatively cool (chromospheric), dark matter appears to stream as if it were flowing down over a boulder. We think that we see material streaming down over a magnetic dome, or separatrix. Notice how the bright knot at the top of that streaming plasma travels with the streams: perhaps matter falls into that bright knot on top of the magnetic dome, piles up into a dense clump that rapidly cools by emitting its energy, and then continues its fall back to the surface as much cooler, absorbing material. |
 |
This (Quicktime/Cinepak)
movie (also accessible by clicking on the top image) shows a
plage region of Active Region 8552 on June 1, 1999 in 4 different
wavelengths covering the upper chromosphere and the low and upper
transition region (clockwise from upper left: H-alpha -350 mÅ,
H-alpha +350 mÅ, taken at the Swedish Vacuum Solar Telescope -
SVST-, TRACE 1550 Å C IV, TRACE 171 Å Fe IX/X). The movie
shows how dynamic and intertwined the upper chromosphere and low
corona of active regions are. Cool jets or spicules, visible as dark
features in the H-alpha images, continuously shoot through the lower
and upper transition region. Spicules are often visible as short-lived
brightenings in the TRACE C IV images and as dark, EUV absorbing
features in the TRACE 171 images. For other movies of spicules, click
here
or here.
The lower image in the frame to the left (click on it for a larger version) shows AR 8552 on June 1, 1999 taken by TRACE in the 171 Å passband, and H-alpha -350 mÅ (taken at the SVST). Yellow crosses show where spicules showed 5 min periodicity during a time period of one hour. De Pontieu, Erdelyi and de Wijn (2003) showed that periodic signals in the upper transition region (left image) are caused by periodic obscuration by cold, dense jets (right image) protruding over low-lying, EUV emitting plasma ("moss", visible as the bright, reticulated pattern in the left image). De Pontieu, Erdelyi and James use the good correlation between spicule occurrence and brightness changes in the upper transition region in a study published in Nature. They develop a computer model that predicts when spicules should occur at a certain location on the Sun. The computer model is driven by observations of velocities at the surface or photosphere of the Sun, and describes how photospheric oscillations and flows can leak into the chromosphere along non-vertical magnetic flux tubes to develop into shock waves which form jets of plasma, or spicules. De Pontieu, Erdelyi and James found that their computer model did a good job of predicting when spicules occur, based on comparisons of the model predictions with the brightness changes in the moss as observed with TRACE. More information can be found here.
Courtesy: Bart De Pontieu (LMSAL).
|
 |
This (QuickTime/JPEG; 2MB)
movie in 195Å shows
Active Region 10652 (rotated by +90 degrees)
just as it reaches the western limb, about to rotate
off the visible solar hemisphere. The movie shows two successive
jets, cooling loops with coronal rain, and the evolution of many
spicules (the nature of which is discussed by De Pontieu, Erdelyi,
and James in the 29 July 2004 issue
of Nature, and on this
web site of our department).
Courtesy: Zoe Frank (LMSAL).
 |
 |
Active region 10649 has been very active, producing 5 X-class flares within
36 hours (until now: 2004/07/16 11am PDT; see the
X-ray light curve). This (QuickTime/JPEG; 4MB)
movie in 171Å shows the
initial evolution of the third of these, starting at 01:46 UT on 16 July.
Courtesy: Zoe Frank (LMSAL).
|
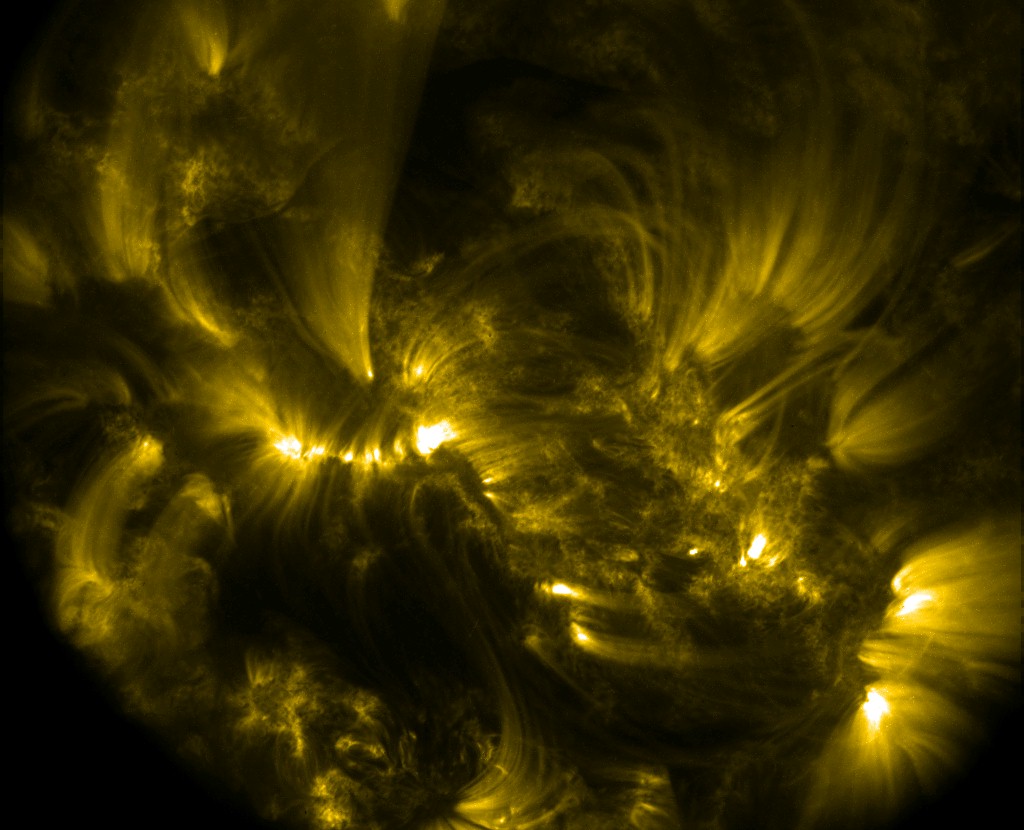 |
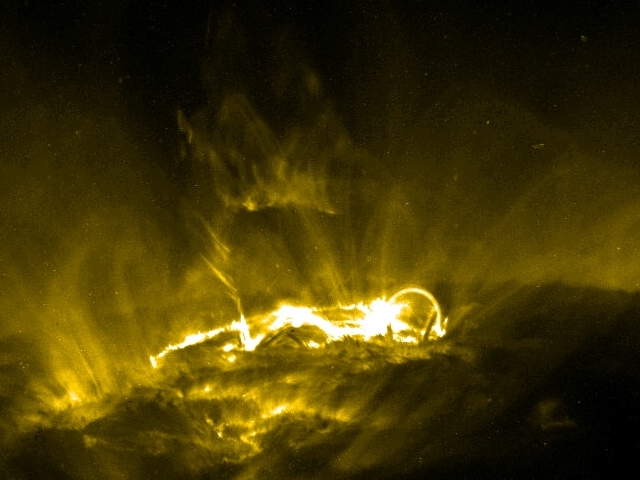
The TRACE exposure times are generally set to expose the relatively bright
structures in an image well, much like a digital camera does. But this
image is a 220-second long exposure (10 times longer than normal) obtained
in the 171Å channel that is most sensitive to emission
from 1 million degree gas. It shows a well-defined, high contrast image,
with a multitude of loops that can be traced quite well agains the background
of other loops or the low-lying 'moss' that forms the base of even hotter
loops that are not seen in this channel of TRACE.
|

 |
The Venus transit revisitedThe two images above are composites of the Venus transit as seen by TRACE in its white-light (top) and 1600Å (bottom) channels (click on the thumbnail images on the left to obtain the full-resolution composites made by Dawn Myers at Goddard Space Flight Center). The apparent wobble of Venus is a consequence of the motion of the TRACE satellite around the Earth (click on the 3rd image on the left to view the TRACE orbit around the Earth), causing a substantial parallax motion on the Sun (click on the bottom image on the left to view the corresponding Venus motion as projected onto the Sun, with geocentric north up; movies courtesy of Glenn Schneider). 
 Glenn Schneider and Jay Pasachoff have carefully analyzed the TRACE
white-light images of the Venus ingress to study the scattering of the Sun's
light through the atmosphere of Venus.
The four images above show the Venus observations for
(1) 05:06:28 UT, (2) 05:20:10 UT, (3) 05:27:27 UT, and (4) 05:33:09 UT,
respectively. These images were processed to bring out very faint
details by removing the background solar emission (so that only the
differences in granular brightness survive) and by correcting for
faint internal reflections in the TRACE telescope optics. Furthermore,
the signals on the disk were weakened by an additional factor of 10. Note
that the scattered light in the atmosphere of Venus is visible first in
at the bottom of image (2), and is substantially brighter when more of
Venus is on the solar disk (image 4). Oh, and Glenn comments that
"Second contact, 053850 UT, is geometrically 'sharp' (except for 'blurring'
by the 1" FWHM TRACE WL PSF) with no
evidence of the classical/historical "black drop" effect (gone, now, the
way of the Martian canals)." - see their
web page for
more details, images, and movies.
|
 |
TRACE observes
reorganiziations of the coronal field all the time. Often these are
rapid, associated with flares and coronal mass ejections. Or they are
very gradual with little brightening. The case shown in this
(QuickTime/JPEG;3.6MB) movie
in 171Å shows a fairly rapid case with no evidence of
flaring. The movie shows 6 hours in the evolution of the corona over
three active regions (ARs 10627, 10628, and 10629). The coronal field
of the central region (AR628), with a sigmoid shape at first, changes
either by opening part of its field into the heliosphere (consistent
with our forecast results
shown in the image above, which has a black open-field contour
touching the following polarity of AR628) or perhaps connecting
elsewhere. |

 |
The two images on the left are composites showing the transit of Venus
on 8 June 2004 as seen in the TRACE visible light (top) and 1600Å
(bottom) channels. As in the Mercury transits in
1999 and in
2003, the trajectory of the planet appears to go up and down. This is
a consequence of the parallax introduced by the motion of TRACE around
the Earth: as TRACE moves over the Earth's north polar regions, Venus is
projected southward on the Sun, and vice versa. The composite shows
Venus at more or less regularly spaced time intervals. There are a few
images missing at times that TRACE changed its observing mode, or when
the data transmission to the ground station failed. But allowing for
those few, the images towards the north appear to be closer spaced than
those towards the south. That too is to be expected from an orbiting
satellite, because when TRACE moves with the planet (over the Earth's
south pole), the parallax causes subsequent images to be spaced by
less than is the case when moving against the planet's direction of motion
when over the north polar regions of the Earth.
More images and movies from the Venus 2004 transit as observed by TRACE
can be seen
here.
|
|
| Home | Mission | Instrument | Team | Operations | Results | Images | Movies | Education | Site Info. | |