

The TRACE images may be used without restrictions
in publications of any kind. We
appreciate an acknowledgement indicating that
the Transition Region and Coronal Explorer, TRACE,
is a mission of the Stanford-Lockheed Institute for Space
Research, and part of the NASA Small Explorer program. More information on
TRACE and other TRACE images can be found
here.
 |
This composite shows NOAA active region 10655 on 3 August 2004,
as observed by TRACE and SOHO. The four images show, clockwise from
the top-left, the TRACE 1600Å image, the white-light image,
and the 171Å coronal image, and the SOHO/MDI magnetogram. Contours
show line-of-sight field strengths of 300G and 600G (dotted and solid
for the two opposite polarities). Note, in particular, the fan of
loops in the 171&ARing; channel ending in the central region of the
leading sunspot. The dark
wedge in the north may well correspond to the edge of
a coronal hole, as suggested in this EIT image
in which contours show open-field boundaries (the white lines are
field lines going into the ecliptic plane; the dashed line is
the projection of the heliospheric current sheet onto the solar surface).
Composite image courtesy Etienne Pariat and
Yuanyong Deng (Obs. de Meudon).
|
 |
NOAA active region 10720 appeared on the solar disk January 11,
2005. It grew to be one of the largest sunspot regions of the current
solar cycle within two days of its emergence. AR720 released 5 GOES X
class flares along with mutiple smaller events during the period
between January 15-20 before it passed behind the west limb of the
Sun. Here are a few samples of the X flares as TRACE saw them in the
C IV 1600Å band and in white light. Courtesy Zoe Frank (LMSAL).
|
 |
Active region NOAA 10720 is one of the most flare-productive regions of the
last few years, with 10 M-class and 5 X-class flares in a week. The
largest flare (to date) from the region was an X7.9 on 20-Jan-2005,
starting at 06:36 UT. The 53 min.
movie (11MB)
showing the UV evolution of the flare. Movie courtesy of Dawn Myers (GSFC).
The proton storm associated with this flare impacted many spacecraft.
Not only those orbiting Earth were affected: the NASA
Deep Impact mission
en route to comet Tempel 1, even went into a safehold until the
electronics could be restarted after the storm passed.
|
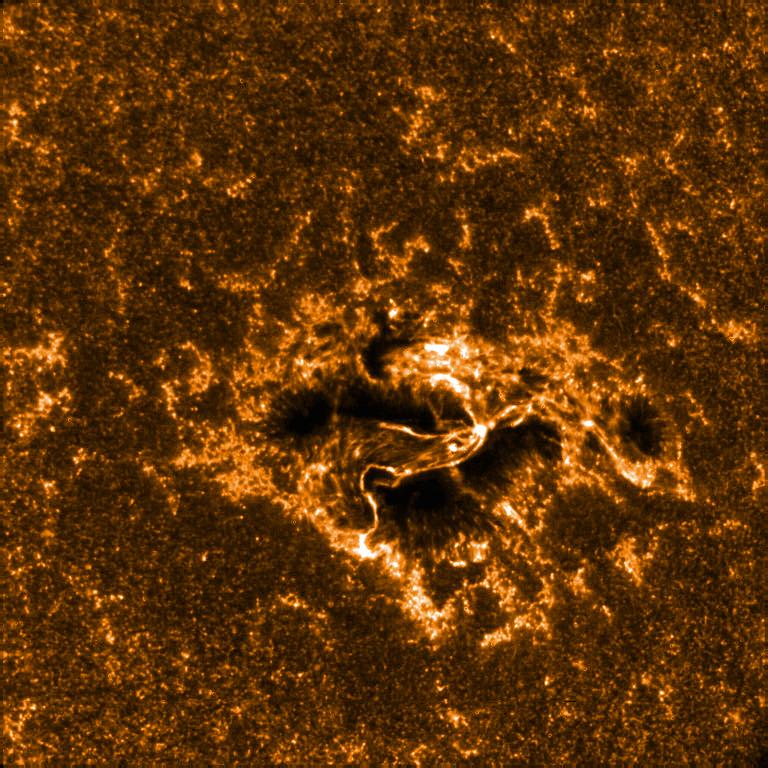 |
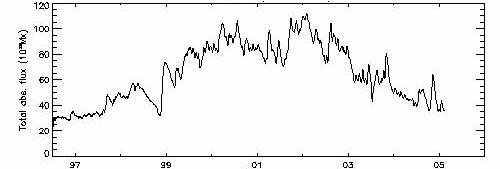 Even though the solar cycle is reaching its end (as can be seen in the flux diagram above - see our solar and space weather forecast), X-class flares still occur. The TRACE image on the left shows a 1600Å ultraviolet image of an X3.8 flare in AR 10720, that started at 6:59 UT. The image, taken at 7:43 UT, shows the large sunspot cluster in the center of the region (see the SOHO/MDI magnetic map for the global picture), with the flare developing right over its central regions. TRACE image courtesy Zoe Frank (LMSAL). |
 |
Fireworks for the new year:The Sun started the new year with fireworks of its own: in the first minute of 2005, this X1.7 flare started in NOAA active region 10715 (shown in the GOES X-ray light curve on the right - click on it to see the full 3-day summary diagram). TRACE observed it in its 1600Å ultraviolet bandpass: the image above is the last frame from this 25 min. QuickTime/JPEG movie (2.3MB) showing the UV evolution of the flare from 12/31/2004 23:59:57 until 01/01/2005 00:24:45 UT. The flare caused no increase in electron or proton fluxes as seen by the GOES satellite; this was no surprise, as AR 10715 was at the time located at (N05,E34), and was neither associated with open magnetic fields nor near any such field that might connect to the Earth (see this rendering from our space weather forecaster). |
 |
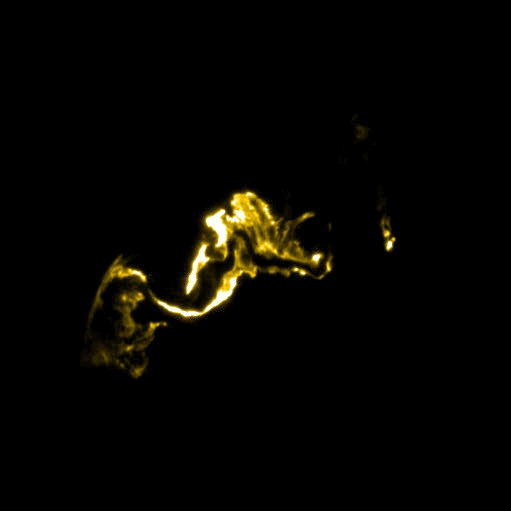
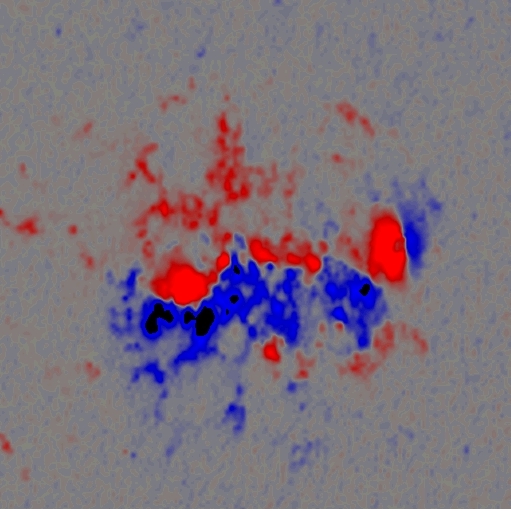
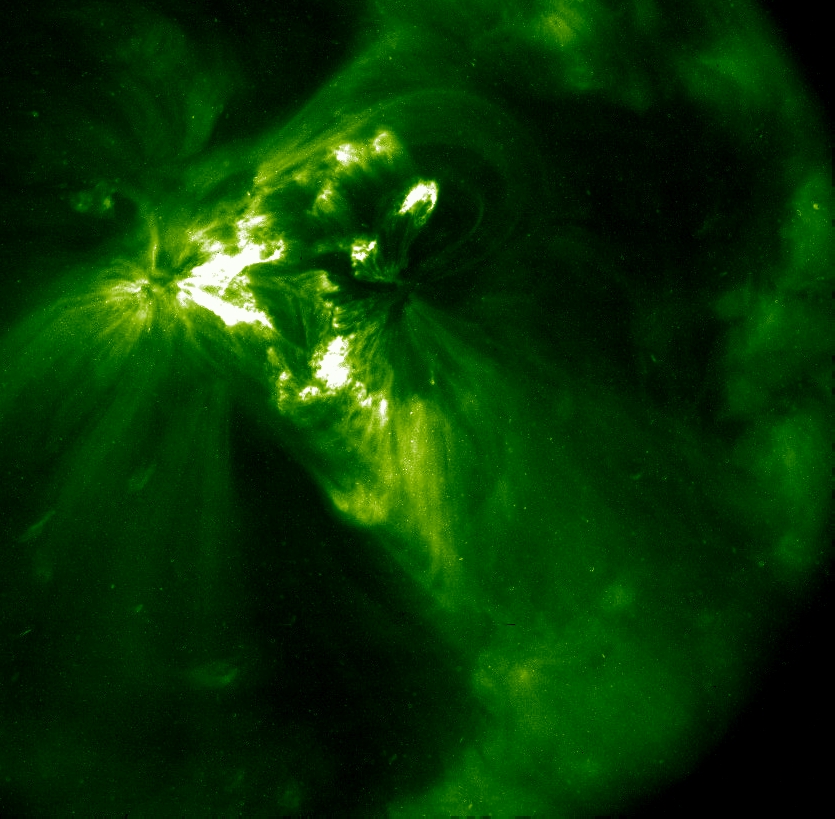
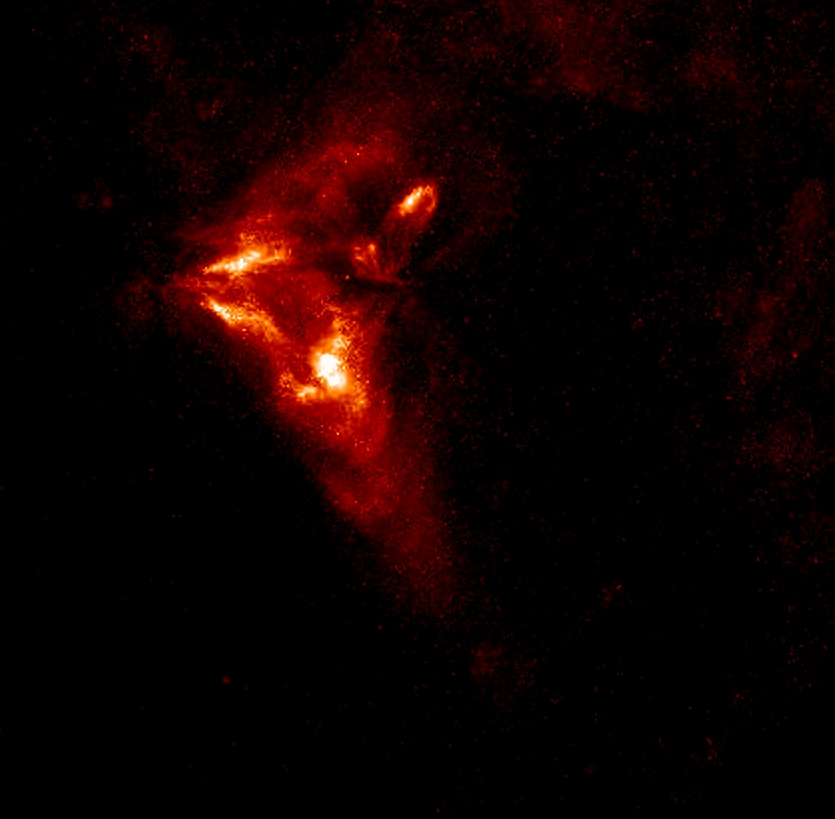
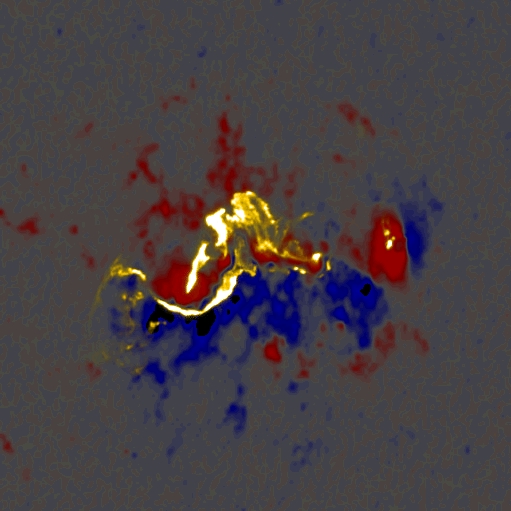 TRACE observed this X2.5 flare in NOAA Active Region 10696 on 2004, November 10. This 55 min. QuickTime/JPEG movie (14.2MB) shows the event as seen in the 1600Å channel at a cadence that is as short as 1.9s during the main eruptive phase of the flare from about 02:04 UT onward. The image on the left shows a negative, logarithmically scaled cutout taken at 02:09:20 UT, zoomed in by a factor of two to reveal the detailed structure. The three images above show the flare at 02:09:20 UT in a different color scale (lag. intensity 95-2000DN), a scaled SOHO/MDI magnetogram (taken at 01:39UT), and a blend of these two images (511x511 pixels of 370km each). The alignment is approximate, moving the images relative to each other until the correspondence appeared optimal. Note that the bright UV regions in over the northern (red) polarity appear to span a gap in the magnetogram; the arch-like structures that connect the extremities of the corresponding emission region appear to reflect the magnetic canopy over a relatively field free patch of the solar surface. Note also that the left-most part of the upper intensity structure (over the red polarity) does not seem to map to an abvious magnetic structure. We are studying how that can be.
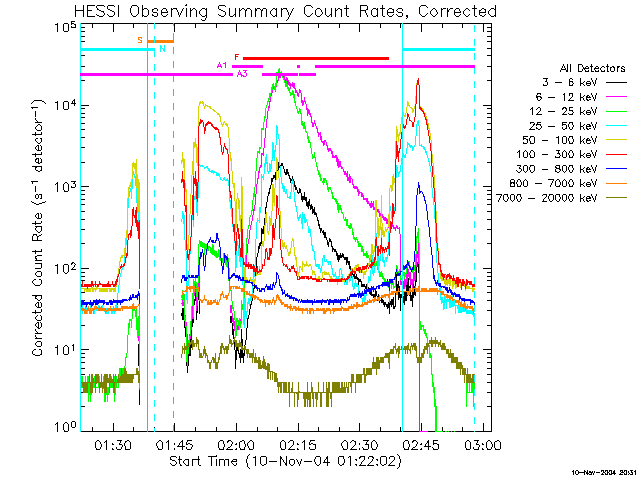
For comparison,
the RHESSI light curves for the flare are shown in the image below. |
 |
Did TRACE see something moving faster than 3500 km/s?This TRACE 171Å image, taken on 2003 August 25 at 03:39 UT, shows a streak spanning over 520 pixels. Ordinarily, we would identify such long, straight streaks with particle hits on the detector. But this one is remarkable, in that it starts exactly at the front of a small destabilizing filament (visible in this QuickTime/JPEG movie (8.9MB)), causing us to believe it is the blurred track of something moving really fast in this 55 second exposure. The track's length corresponds to 191,000 kilometers if that object was moving in the plane of the sky, and more if it was moving towards or away from us. That gives it a velocity of over 3,500 km/s (or 7.8 million miles an hour). [A similar events is shown here]. So is
it a solar event? Particle tracks can be that long, see, for
example, these cases:
1,
2,
3. Cases
2 and 3 both show clear intensity modulations along the tracks, and
since case 3 is taken with no solar signal on the detector, that modulation
can clearly occur somehow within the detector. So the length and intensity
profiles of the track are inconclusive. What is the chance of such
a long track starting from near the end of a solar event, roughly
in the right direction: well to within 10 of a million pixels, to within,
say, 5 degrees of the solar event has a probability of 1 in 7 million. In
a sample of 2000 similar (171Å, 55s) exposures, we found 2 tracks
longer than 500 pixels, or 1 in 1000. The probability that this is a random
particle event is therefore 1 in 7 billion. As TRACE has made about
7 million exposures thus far, that leaves us with 1 in 1000. So it is
rather unlikely to be a particle traveling through the detector, yet
it is hard to believe something on the Sun could produce this image.
|
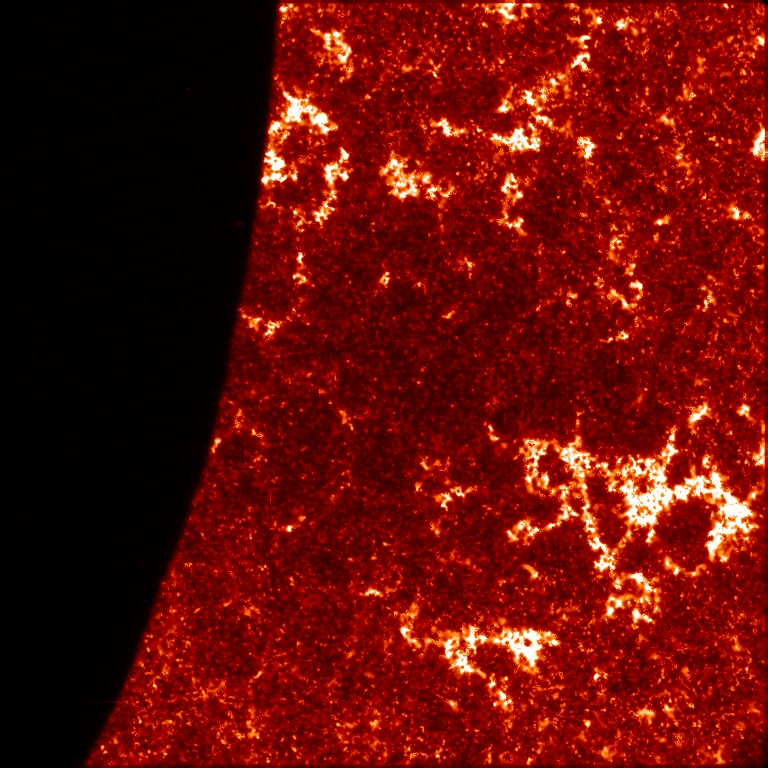 |
This image was taken on 14 October 2004 at 02:37:08 UT in the 1600Å
passband of TRACE during a partial solar eclipse: the dark area on the left
of the image is the moon that covers a magnetically quiet area of
the Sun in which bright magnetic concentrations outline parts of the
supergranular convection cells. The slight darkening in the
central part of the image shows the wear of the CCD imaging system:
the many millions of exposures of the Sun that TRACE has taken so
far have reduced the camera sensitivity to about half its value at the
time of launch six years ago. Courtesy of Dawn Myers, GSFC.
|
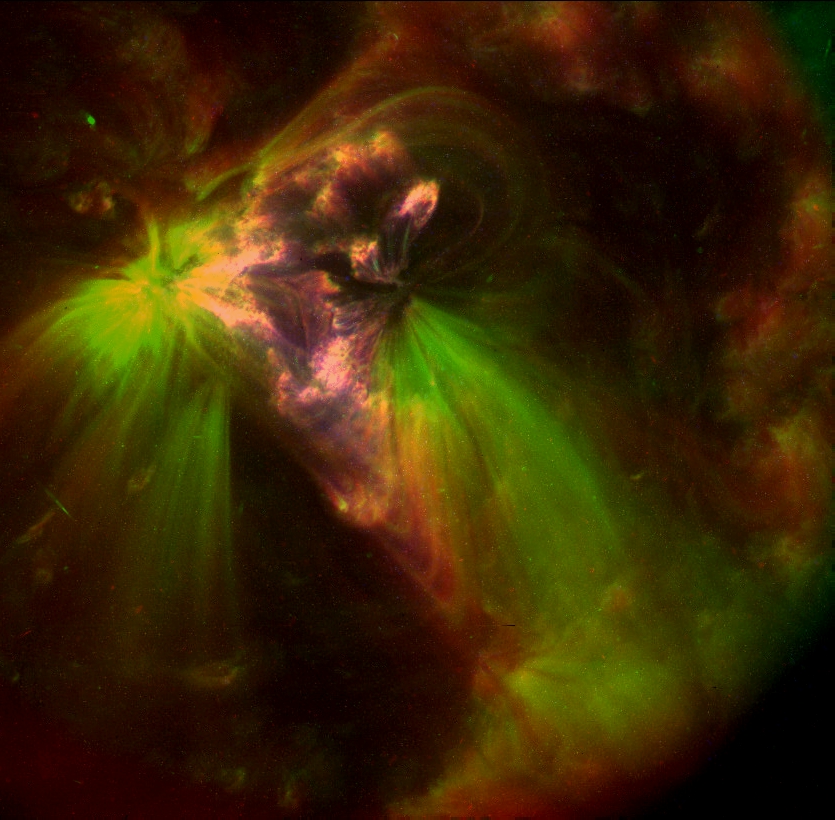 |
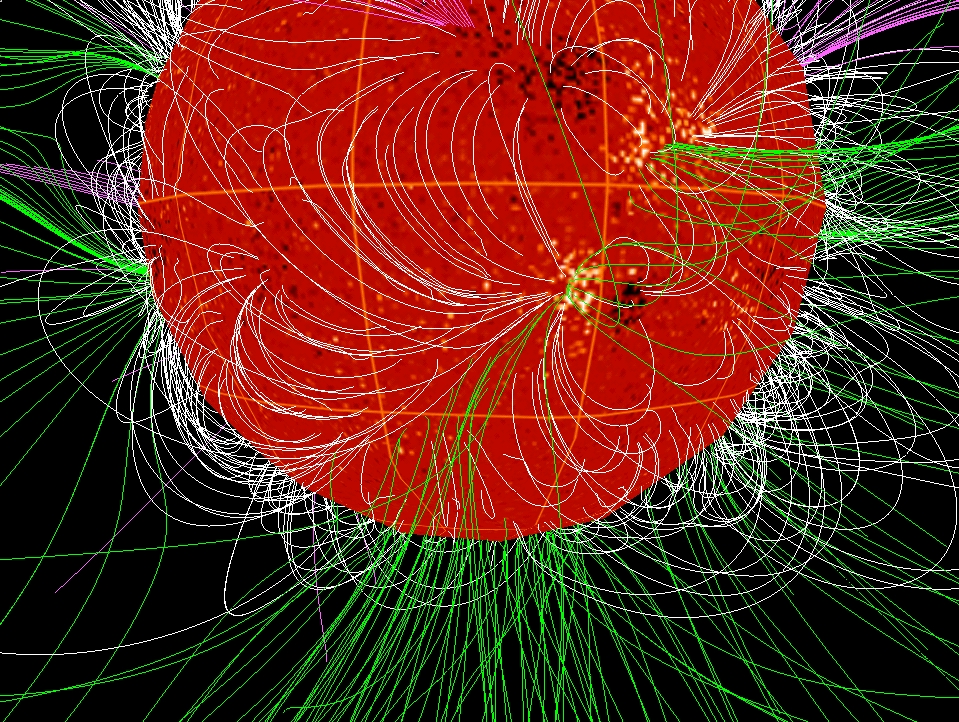
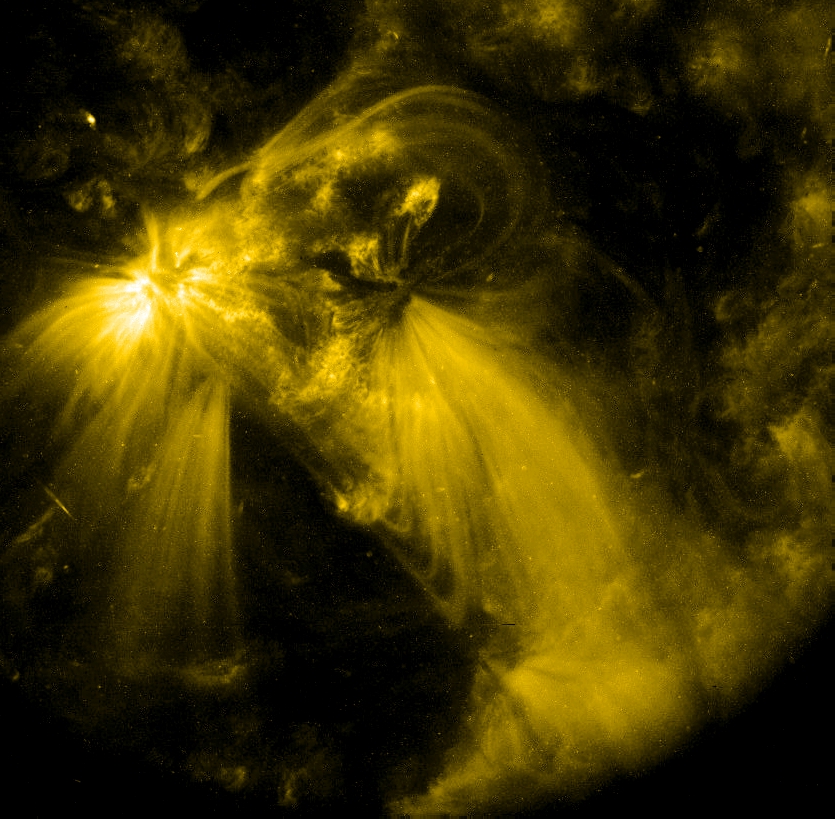
 Open and closed field linesThe false-color image on the left is a 3-color composite image of AR 10673 taken by TRACE on 2004 September 23 (195&ARing; in red at 19:09:23 UT, 171Å in green at 19:11:06 UT, and 284Å in blue at 19:10:06 UT; the three separate images are shown above). The image shows a dark wedge south of the active region, which the PFSS model field suggests is in fact a coronal hole (see the green - open - field lines in the PFSS model in the field rendering above). Next to this coronal hole, on the lower, righthand side of it, are loops with a pronounced kink at their tops. These look like they are field lines that approach a cusp at the top of the closed-field domain, directly adjacent to the open field. |
 |
Flare catalog |
|
| Home | Mission | Instrument | Team | Operations | Results | Images | Movies | Education | Site Info. | |