

The TRACE images may be used without restrictions
in publications of any kind. We
appreciate an acknowledgement indicating that
the Transition Region and Coronal Explorer, TRACE,
is a mission of the Stanford-Lockheed Institute for Space
Research, and part of the NASA Small Explorer program. More information on
TRACE and other TRACE images can be found
here.
  |
In the morning of 27 July 2005, TRACE observed the onset of
an M3.7 flare (with maximum X-ray emission at 05:02UT), associated
with a filament eruption and coronal mass ejection. This 3-hour
movie (8.7MB), taken
in the 171Å channel, shows a very gradual rise in the filament
(or, rather, the prominence as it is seen off the solar limb in
these images which were rotated clockwise so that north is to the right)
up to about 04:28UT. Then, the velocity increases rapidly, rapidly
evolving brightenings shoot along the filament, and then the structure
shoots up into the heliosphere. By the time the X-ray emission peaks
(05:02UT), the eruption is over, while the cooling loop arcade begins
to form just beyond the limb, with a residual filament/prominence seen in
front of it. The overlying loops are seen to bend out of the way until they are likely forced open by the rising filament. Interestingly, the lower loops towards the right/north at first bend out of the way, but then the eruption proceeds so quickly that they begin to oscillate. This 5-day
movie (1MB) coronagraphic
movie (taken by the SOHO/LASCO/C2 instrument) shows the higher evolution
of the coronal mass ejection - see also the lower still image to the left,
taken at 05:08UT.
|
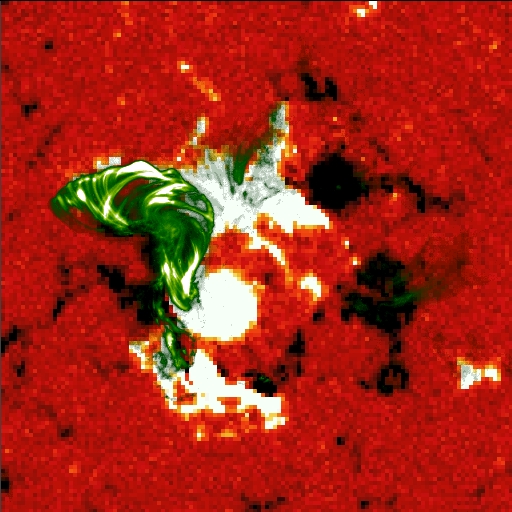 |
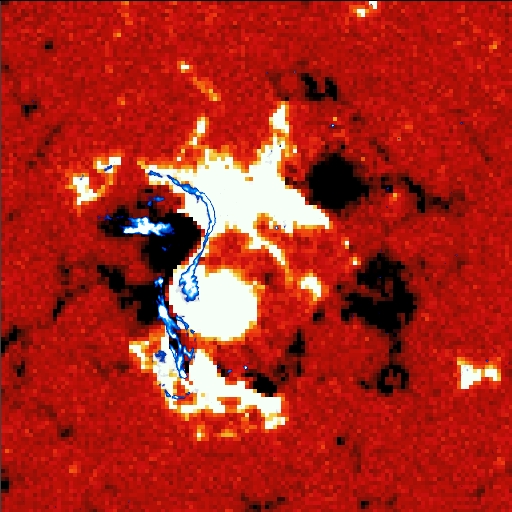
TRACE observed the M4.9 flare in Active Region 10786, which the
GOES satellite started to see at 16:07 UT. The image on the left is
a composite of the TRACE 171Å image blended with the SOHO/MDI
magnetogram, both observed at 16:50 UT. The image on the right is
a blend of the TRACE 1600Å image, taken only seconds
after the 171Å image, blended with the same magnetogram. The
1600Å image shows (in blue/white) the two-ribbon structure,
outlining the bases of the coronal loops seen in 171Å. The ribbons
trace a path through neighboring opposite polarities, including spot
umbral and penumbral field. The 171Å image shows a clearly
sheared field configuration, particularly at the top-left end of
the cooling arcade. Image suggestion by Dawn Myers (GSFC).
|
 |
Filaments/prominences erupt on a wide range of scales. The largest
ones, often associated with coronal mass ejections and geomagnetic
storms, are spectacular. The smaller ones generally go unnoticed.
But this one does get mentioned at least here:
the 2h movie (2.3MB) shows a
destabilization of a small filament (or fibril), seen in the 195Aring;
channel of TRACE. The filament, not even 2500 km long, is seen on the
limb at the left of the movie's field of view (150000 km to a side,
rotated so that solar north is to the right).
It rises in a matter of 4 minutes with an average velocity of 10 km/s,
hardly impressive compared with speeds of up to 1000 km/s for the largest
eruptions. Notice that two hours later, bright loops are seen at that
location, arching some 3000 km above the forest of spicules. This cannot
be attributed to the solar rotation only, so we think that new field
emerged onto the Sun (probably an ephemeral region in the quiet-Sun
network) which triggered the destabilazation of the mini-filament. It
would seem, by the way, that another such event is seen around 2:20 UT
at the right-hand side of the field of view, but this could be part of
the larger filament seen towards the lower right.
|
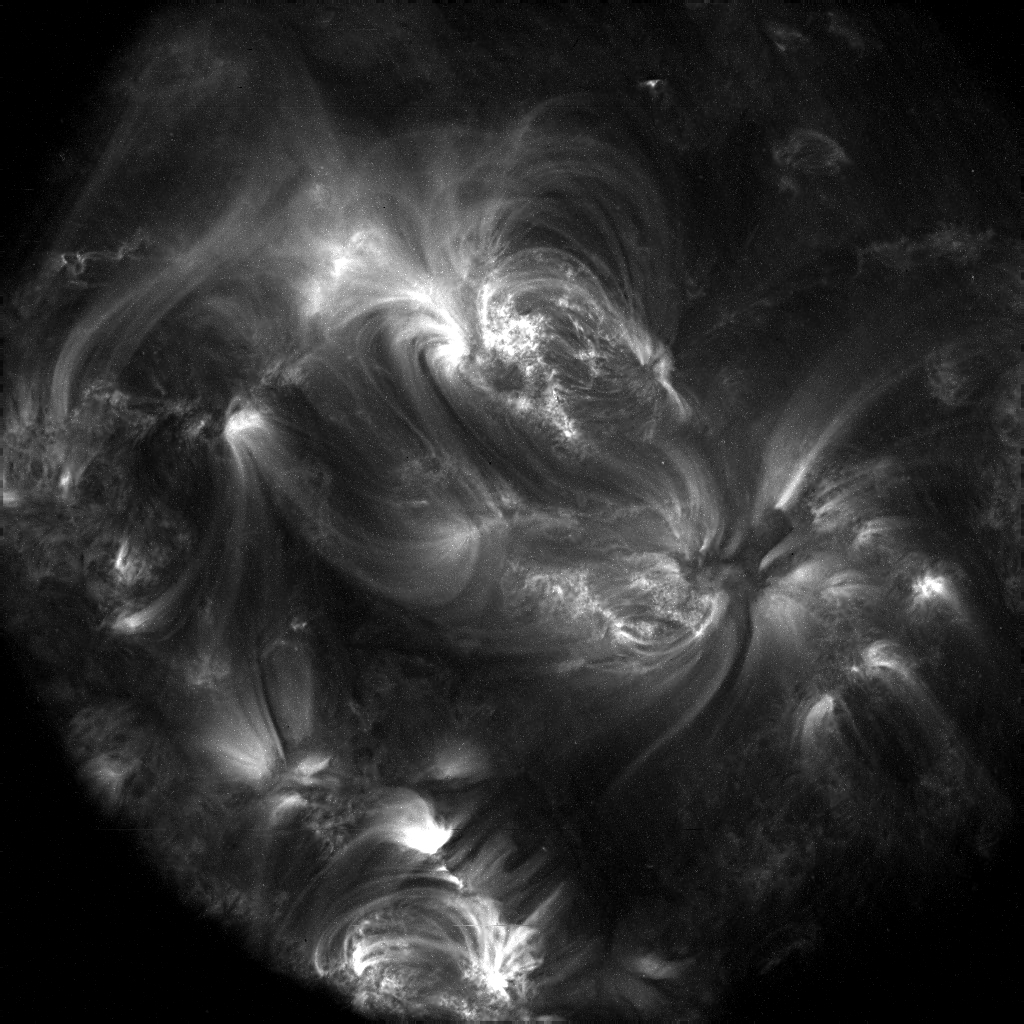 |
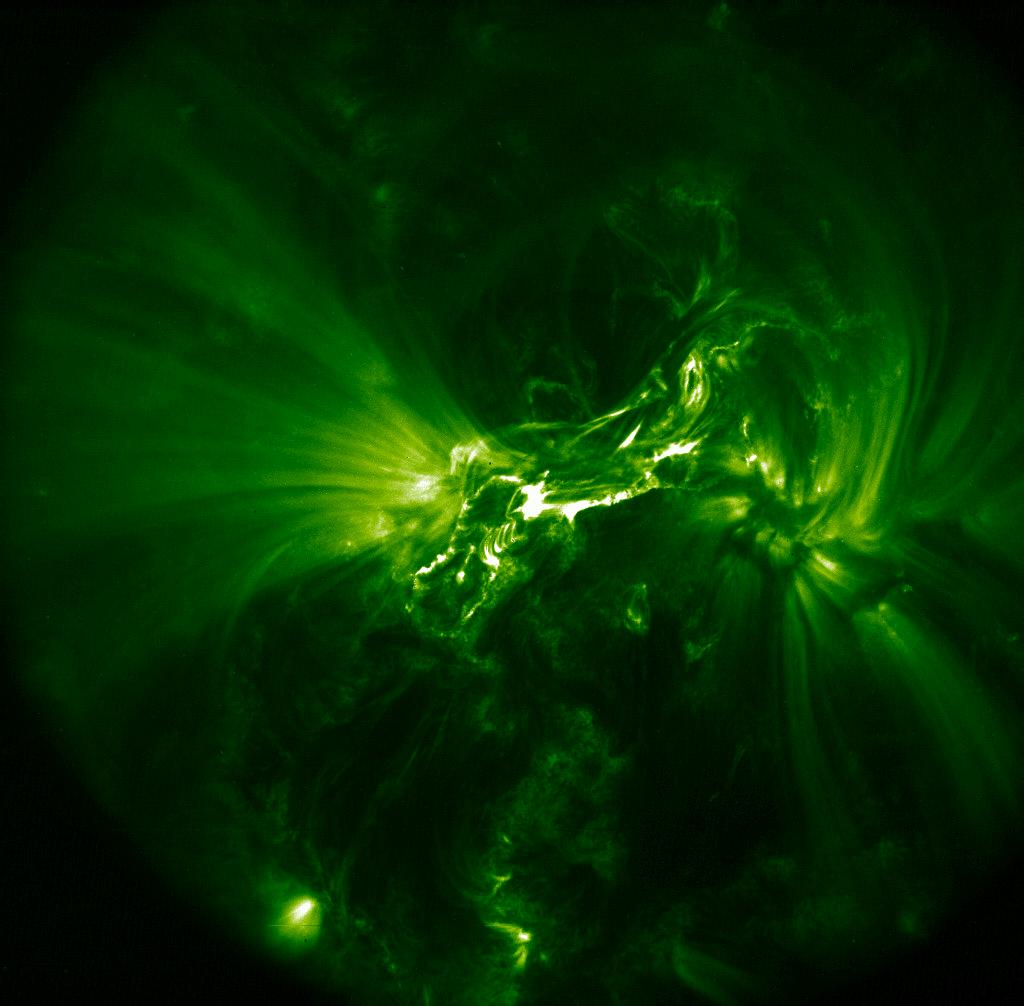
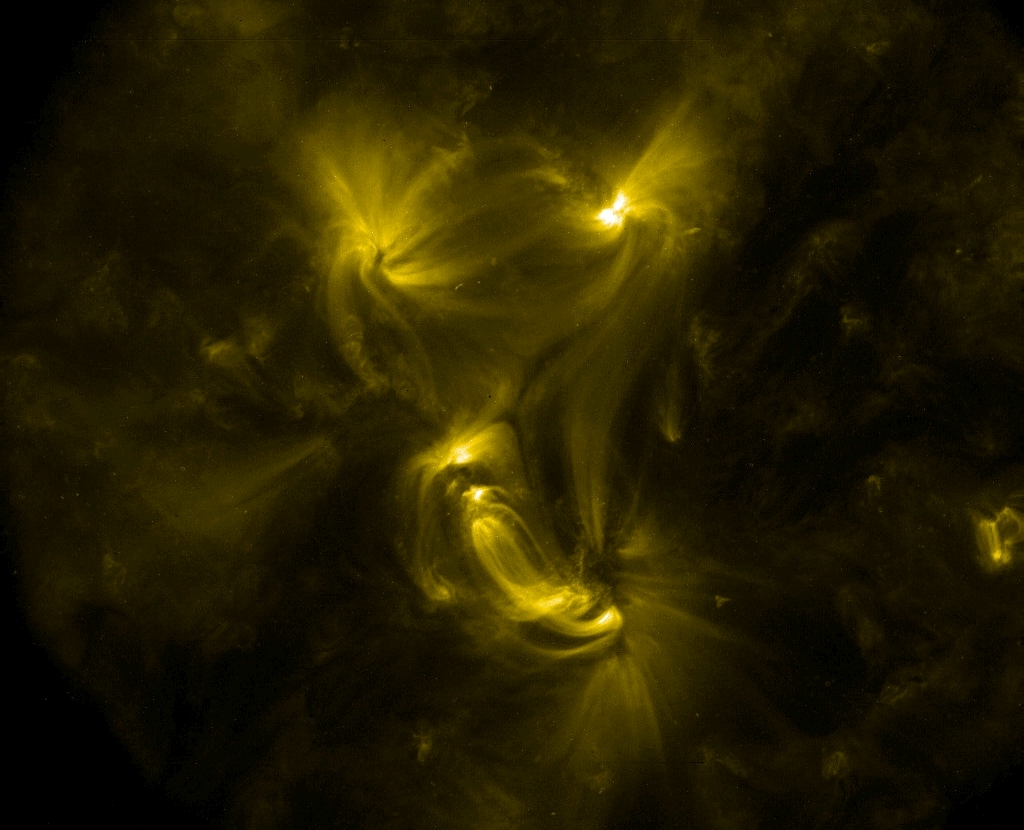
This image of the Sun's corona on 20 June 2002, observed by TRACE
in its 171Å passband (characteristic of plasma around one million
Kelvin) show a remarkable richness of magnetic connections, not only
within the active regions themselves, but also from region to region.
TRACE commonly observes inter-active-region
connections whenever regions lie close enough together that result from
the efficient magnetic reconnection that occurs throughout the solar corona.
|
 |
This composite of images shows the solar atmosphere in different wavelengths.
The central image is a three-color composite of TRACE images in which
the green is the coolest, red somewhat hotter, and white-yellow the hottest
part of the solar corona. This mosaic is made up of 3 exposures at each of
23 pointings; the green, blue, and red color tables in this ``true color''
image represent the 171A (1 MK), 195A (1.5 MK), and 284A (2 MK) channels,
respectively. The surrounding images are, clockwise starting from the top:
SOHO/MDI magnetic map, white light, TRACE 1700A continuum,TRACE Lyman alpha,
TRACE 171A, TRACE 195A, TRACE 284A, YOHKOH/SXT X-ray image. The composite was
prepared by Joe Covington (when at Lockheed Martin Missiles and
Space, Palo Alto). Here is a 2kx2k JPEG version.
|
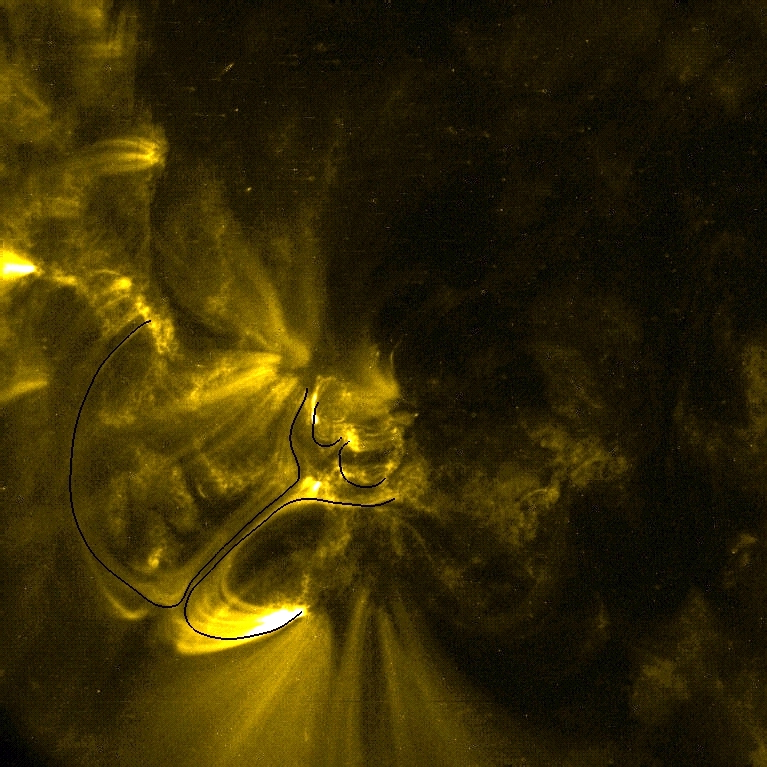 |
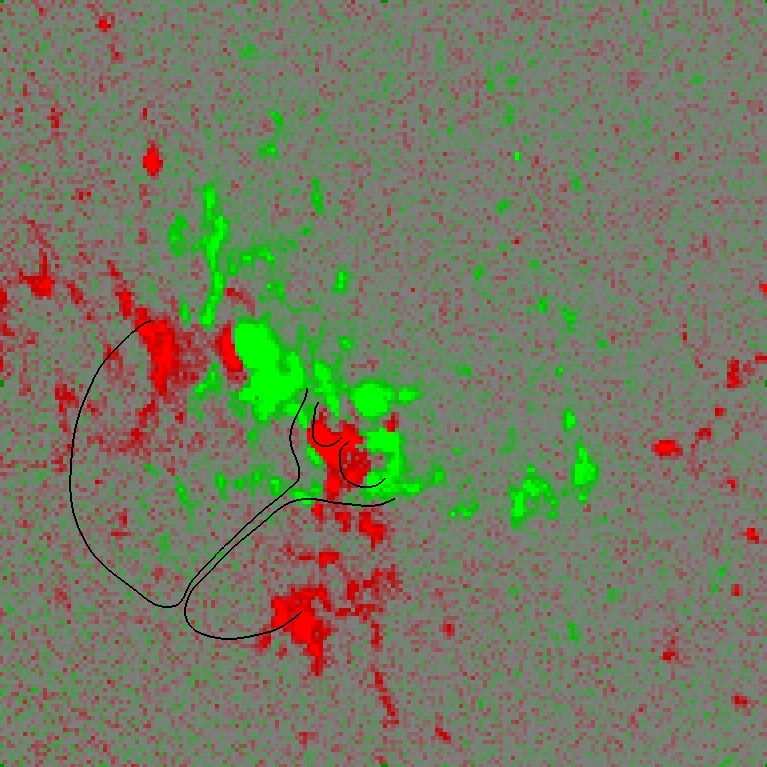 TRACE observed Active Region 10767 on 24 May 2005. The 171Å image on the left, taken at 08:25 UT shows an interesting magnetic configuration, which likely contains a null point and an edge-on view of a separator surface that separates different domains of connectivity. Four field lines have been outlined by black lines. These lines are repeated over the magnetogram (red and green for opposite polarities) observed by SOHO/MDI at 01UT, using an approximate scaling factor from TRACE to MDI. The polarity pattern for the field line footpoints supports the interpretation of a corona X point low over the active region. |
 |
On 6 May 2005, TRACE observed the initiation of a coronal mass
ejection from AR10758. Most of the event is covered only in the
1600Å passband, but there are some images in the coronal 171Å
channel, like the one shown here. The C8.5 flare associated with the
event started at 16:03 UT, 27 minutes before this images was taken,
and continued to rise in X-ray brightness until 17:05 UT. The TRACE
image shows AR10758 south-east of disk center, with the flare ribbons
still glowing, and remnants of a dark filament contained within
the glowing low magnetic field. Image courtesy of Zoe Frank (LMSAL).
|
 |
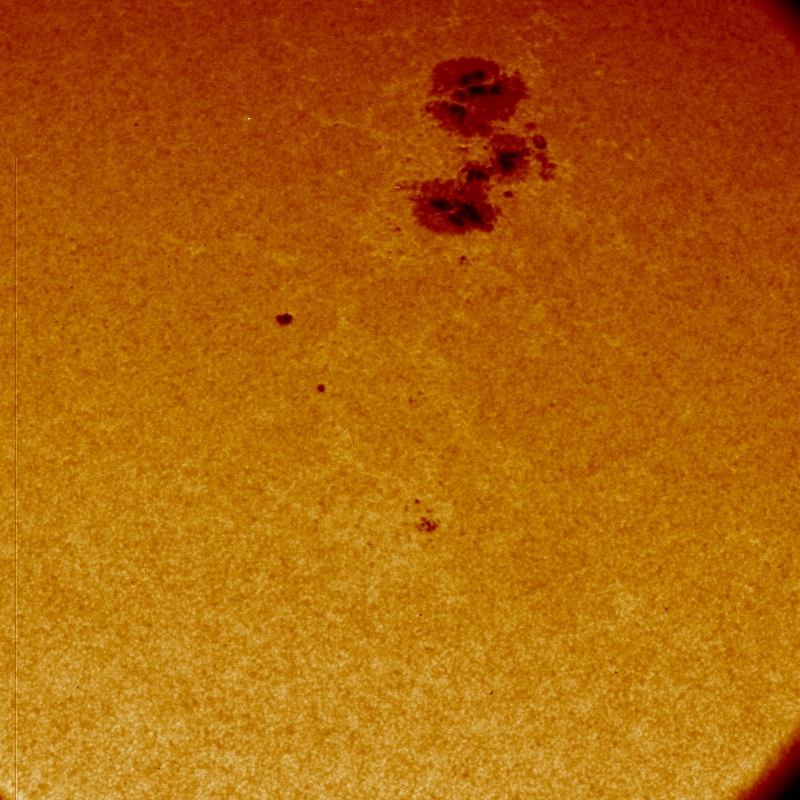 The 171Å image (left) taken by TRACE (rotated by 90 degrees counterclockwise) shows Active Regions 10760 (bottom) and 10758 (top) as they approach the Sun's western limb. AR 10758 is the more active one, with substantial sunspots. It's quiet neighbor, AR 10760 (just inside the MDI high-resolution area shown by the box on this full-disk magnetogram taken a day earlier), shows a beautiful "sunflower," i.e., an almost complete fan of relatively cool, bright loops forming what appears to be a dish or the cup of a flower. Such fans have often been seen to emanate from sunspots, but in this case there is at most a faint cluster of pores, in the process of coming together to form a spot-like cluster (although a real spot apparently never formed; see the MDI image for May 13); at the time of the observations there is only a faint reduction in intensity at the base of the loop fan (cf., the image on the right, taken in white light only 15 minutes earlier). So although these fans were taken to emanate from the umbral/penumbral interface, that is clearly not the case here. |
 |
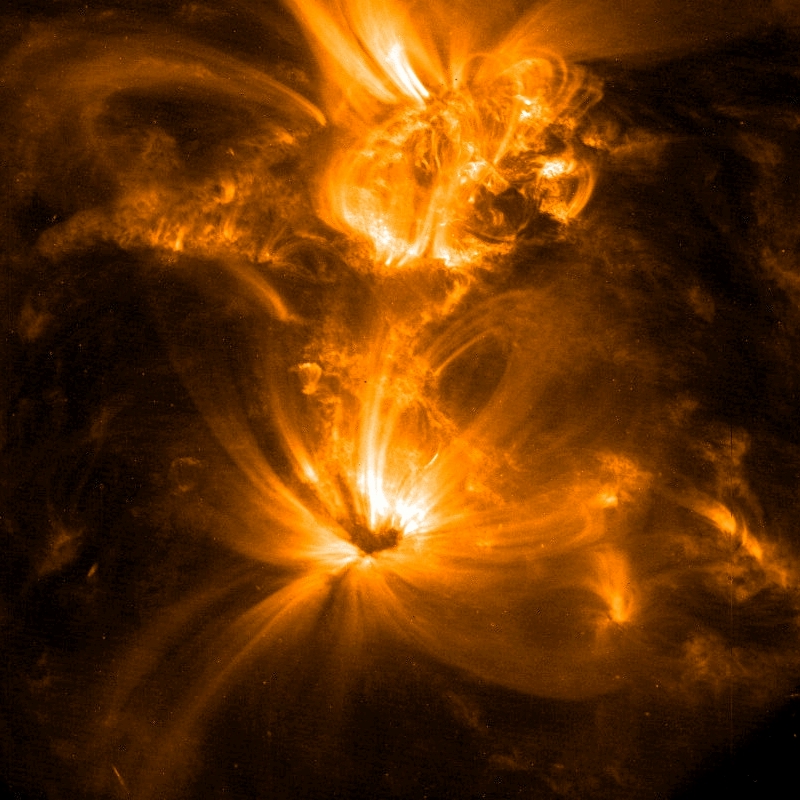
This pair of weak active regions was observed by TRACE on 29 March
2005. The SOHO/MDI
magnetogram shows the magnetic axes of these regions to be mostly
anti-parallel, as expected for regions on opposite hemispheres. The
regions are connected by a multitude of trans-equatorial loops in
addition to the many internal loops that connect the leading to the
trailing polarities. Right in the middle of the image is an X-point
like configuration, revealing a null point such as is expected for
this configuration. A
comparison
of a TRACE image taken 3 hours earlier to a potential-field model for
the corresponding magnetic map shows, interestingly, a similar X
point, but it appears rotated somewhat off the position where the
TRACE observations would put it (which shows little evolution in the 3
intervening hours). Perhaps electrical currents warp the field, or
perhaps the configuration is ioutlined ncompletely in both the model
field lines and in coronal structure as seen by TRACE so that we are
looking at different aspects of the same structure?
|
 |
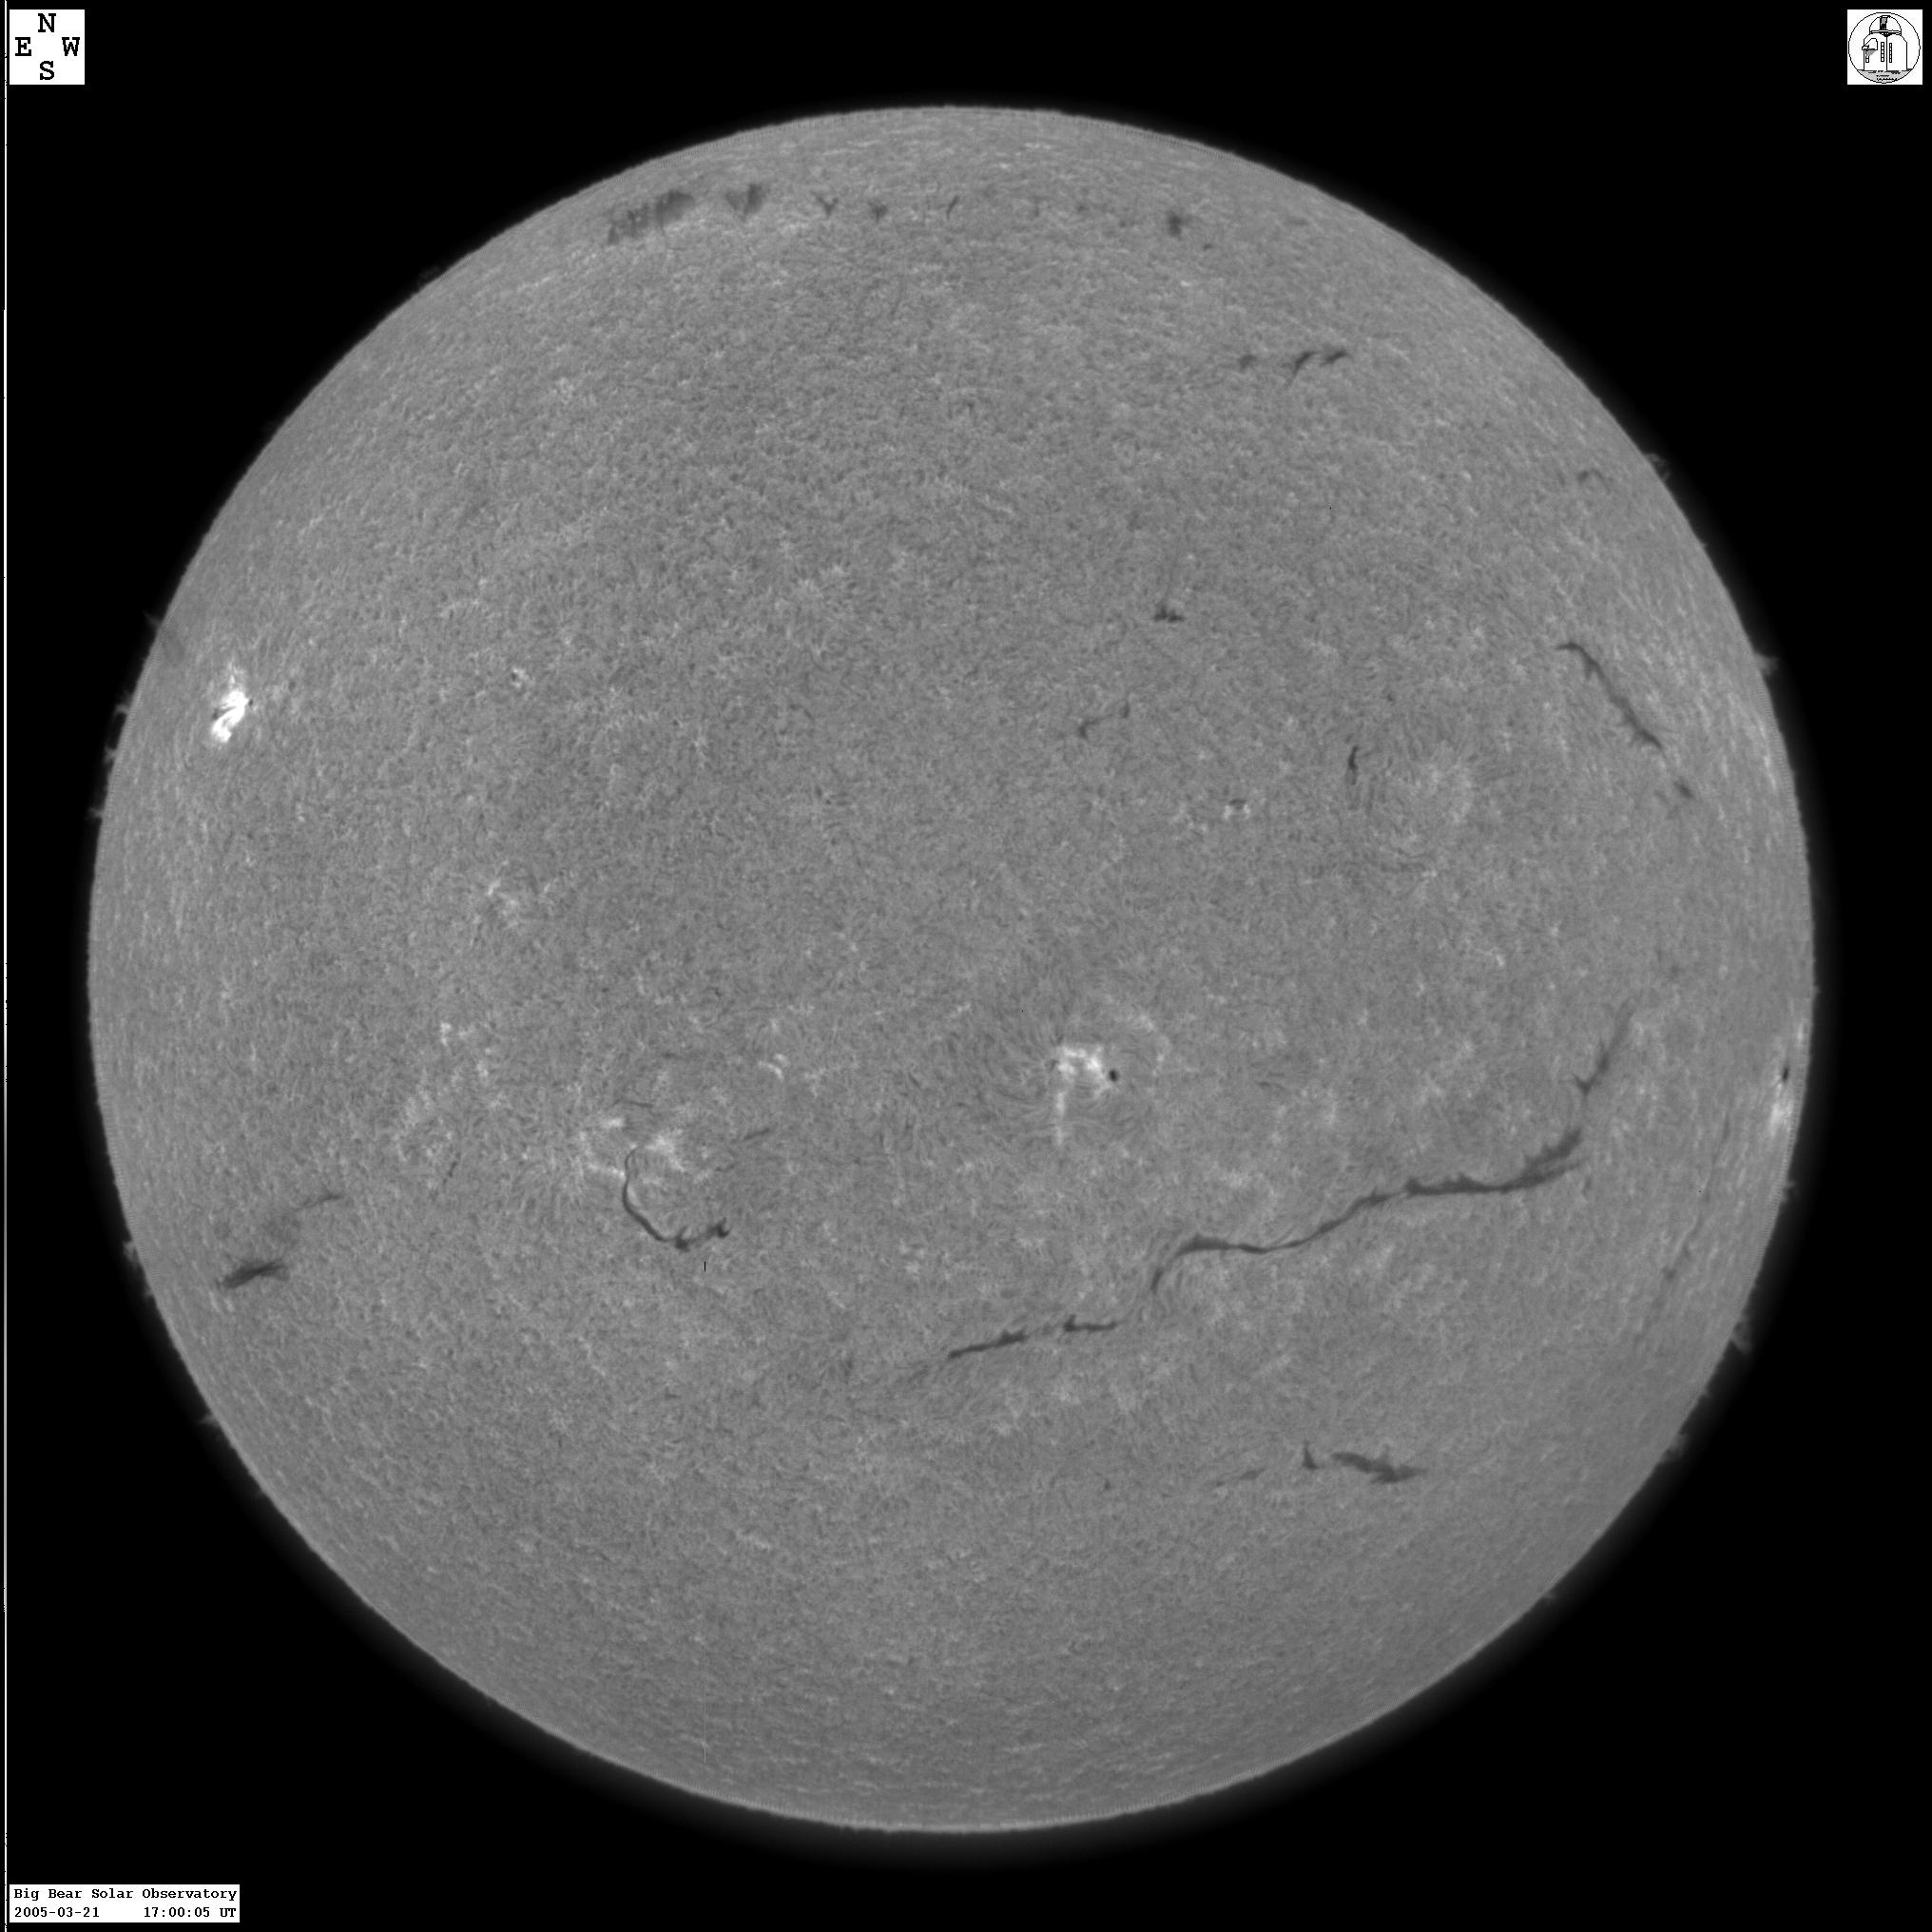
TRACE observed this long filament on 23 March 2005, at the Sun's western
limb (image rotated by +90 degrees). The long filament extends over
some 60 degrees on the Sun, making it about 700,000 km long (
see this BBSO
Halpha image taken two days before).
Courtesy: Trish Jibben (MSU).
|
|
| Home | Mission | Instrument | Team | Operations | Results | Images | Movies | Education | Site Info. | |