

The TRACE images may be used without restrictions
in publications of any kind. We
appreciate an acknowledgement indicating that
the Transition Region and Coronal Explorer, TRACE,
is a mission of the Stanford-Lockheed Institute for Space
Research, and part of the NASA Small Explorer program. More information on
TRACE and other TRACE images can be found
here.
 |
As it was the first to see the
annular eclipse on 2005/10/03,
so it was the last: the image shows the Moon covering the corona over
the eastern limb of the Sun at 13:38:47 UT (rotated over +90 degrees,
with north to the right). TRACE was moving southward in its orbit, so
that parallax effects caused the Moon to move rapidly upward (or
to the right in the rotated images) as seen projected
against the solar corona. This short
movie (0.3MB)
shows how fast the Moon moved: the edge near the Sun is fairly sharp
in these 32 second exposures in the 171Å channel, but the other
edges are clearly blurred by the apparent motion of the Moon during
the exposures.
|
 |
TRACE observed the eclipse on 1005/10/03 even before it started on Earth:
being in orbit above the Earth, and over the western limb at the time,
the first image of the Moon covering the Sun was taken at 08:03 UT,
while Earth observers had to wait anoter half hour befor the beginning of
this annular eclipse. The white-light image shows the limb of the Moon,
with mountain ranges clearly visible, against the north-western edge of
the Sun. The circular edge at the bottom of the image is vignetting
caused by the outline
of the filter wheel that is projected onto the camera (the entire Sun is
as large as the Moon viewed from Earth).
For more information on eclipses, visit Fred Espenak's eclipse pages.
|
 |
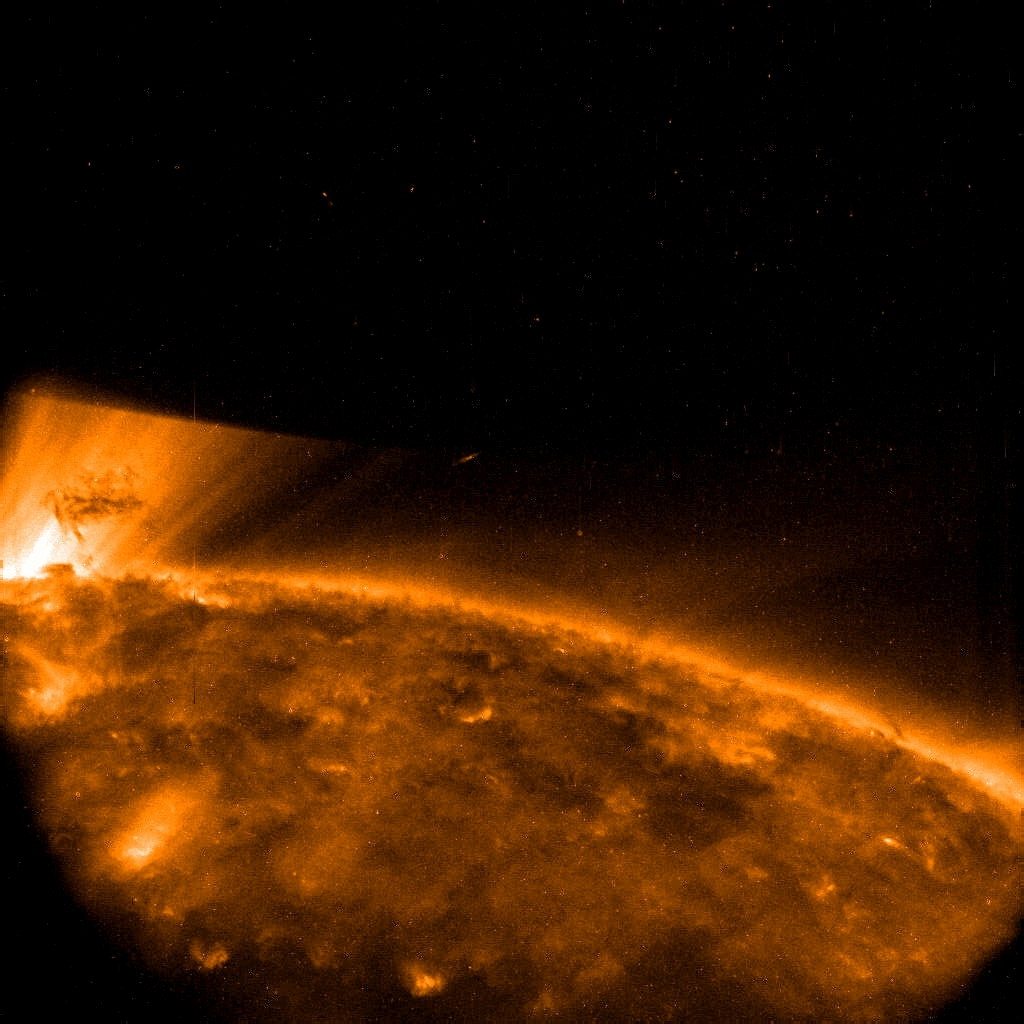
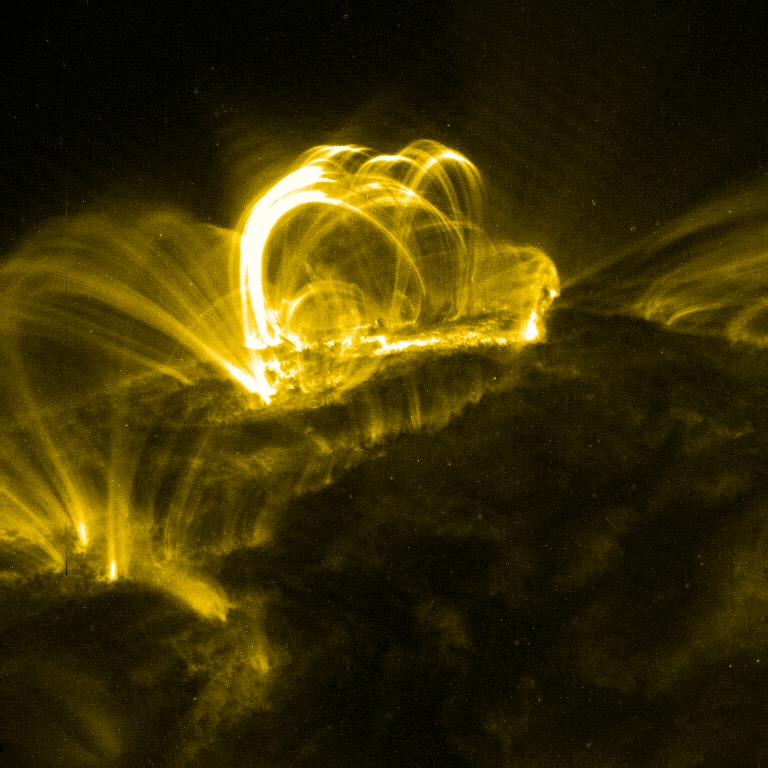
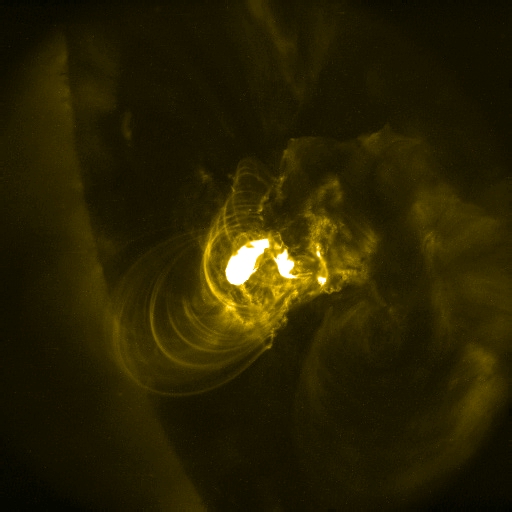
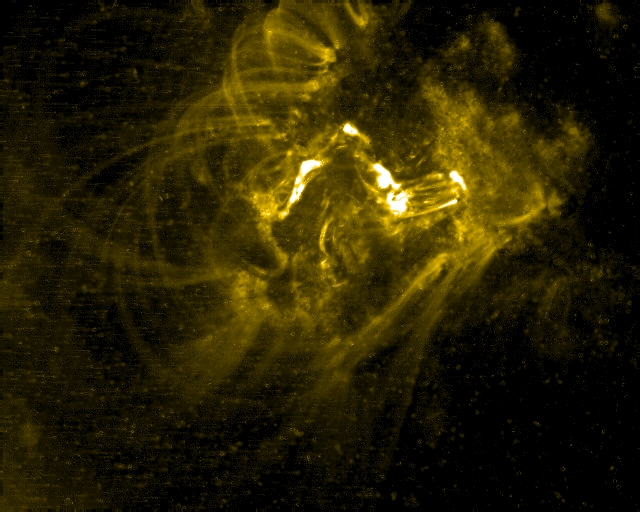
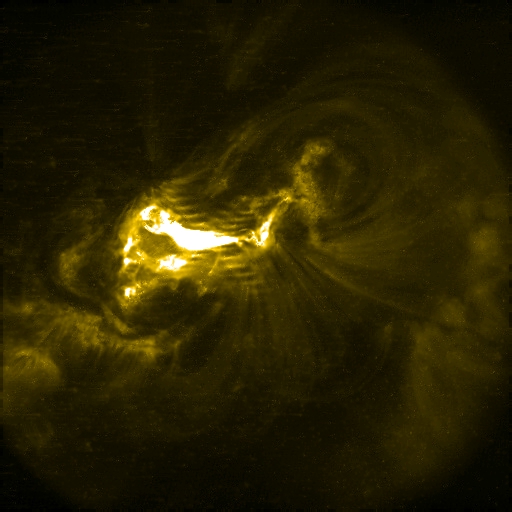
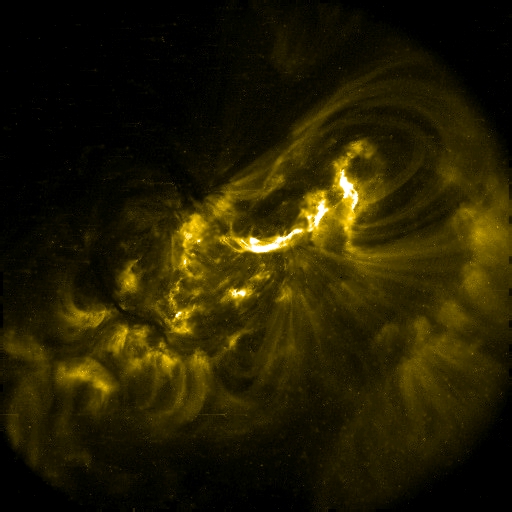
The Transition Region and Coronal Explorer, TRACE, provides the
highest-resolution images of the corona that are currently available
(at 0.5 arcsecond pixels, or 1 arcsecond resolution). The instrument
observed this filament eruption on September 30, 1998. The image,
taken at 14:21:24 UT in the 171Å channel, shows a filament very
early in its eruption, showing up dark against the backdrop of a
arcade of loops; the big, dark filament is rising into interplanetary
space with an increasing velocity that already exceeds 100
km/sec. These brightly glowing loops are the result of an earlier
flare, cooling down from temperatures of several million degrees. As
the loops cool, material drains from them, streaming back towards the
solar surface under the influence of gravity. This is seen in this
image as thin, dark strands of gas at approximately 10,000 degrees
that absorbs the extreme ultraviolet emission from other, hotter gases
behind them. This one image thus shows a range of temperatures that
exceeds a factor of 100, with dark material both falling down and
being thrust away from the Sun.
A high resolution (1600x1600 pixel) version of this image can be accessed
here.
|
 |
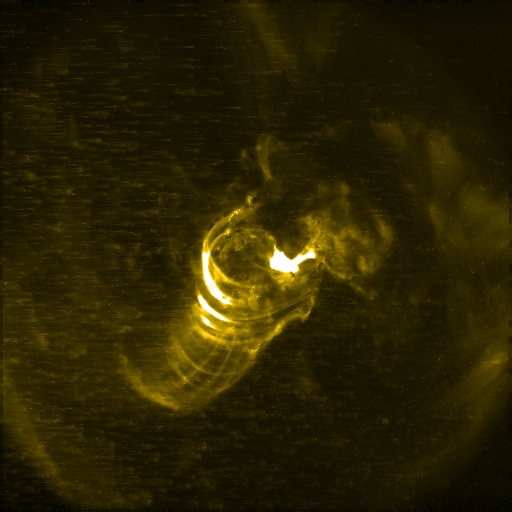
These two 2-h movies
(movie (4.0MB)
for 2005/06/16 19:00-21:00 UT,
movie (3.5MB)
for 2005/07/27 03:45-05:00 UT) observed
in the TRACE 171Å channel, show two erupting filaments. The first
show the far segment of an essentially circular filament destabilizing,
and moving straight up into the corona. The second one shows an
erupting filament that deforms the coronal field to the right of it,
exciting rapidly-damped oscillations as the field adjusts to the rapid
changes. The movies and images show only half of the TRACE full field
of view (i.e., 512 pixels of approximately 720 km each).
|
 |
This 10-hour
movie (30MB), taken
in the 171Å channel, shows the evolution of a series
of flares between 20 UT on
September 8, 2005, through 06 UT the next morning. The largest flare
is an X5.4 starting at 20:52UT, followed by
an M1.0 at 02:08 UT,
an M1.1 at 02:33 UT,
an X1.1 at 02:43 UT,
an M1.8 at 04:46 UT,
and an M6.2 at 05:32 UT. Notice how the high loops to the right (north
in the rotated movie) change in shape and even oscillate somewhat immediately
following the X5.4 flare. The next three M-class flares hardly register
in the TRACE image sequence. But the X1.1 is clearly visible. The final
M1.8 flare and its aftermath show an interesting series of small ejecta,
starting from the central flare region, being shot up into the coronal
field, and either fading away or falling back down; we count
at least 8 such events before the movie ends.
Click here for a listing (with links) to all the X
and M class flares from AR10808.
|
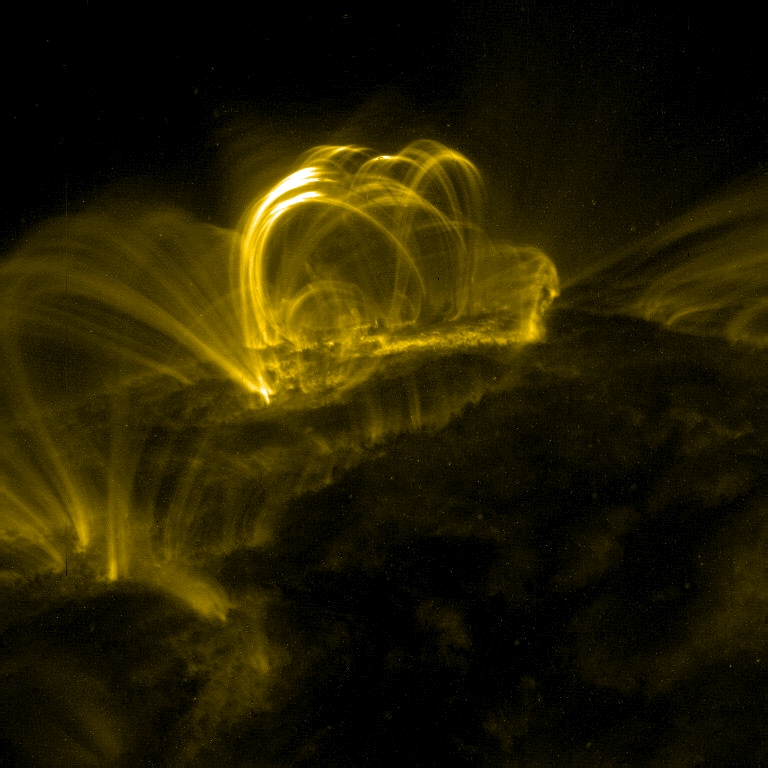 |
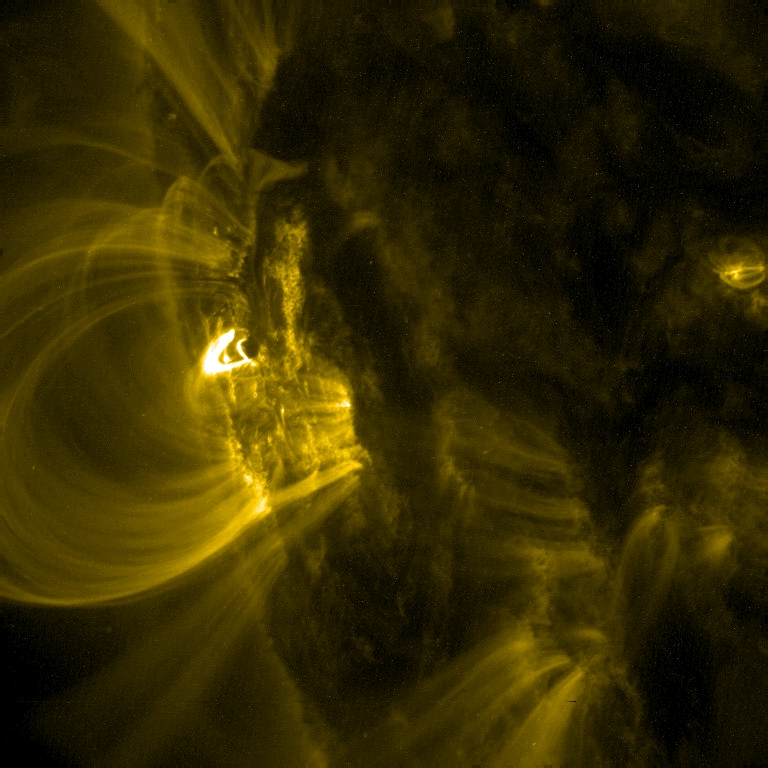
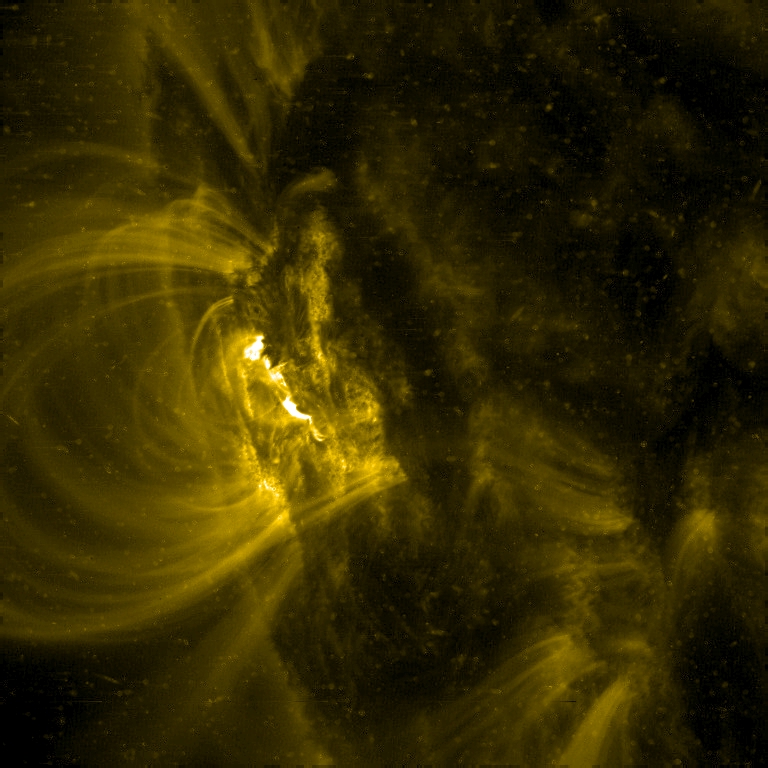
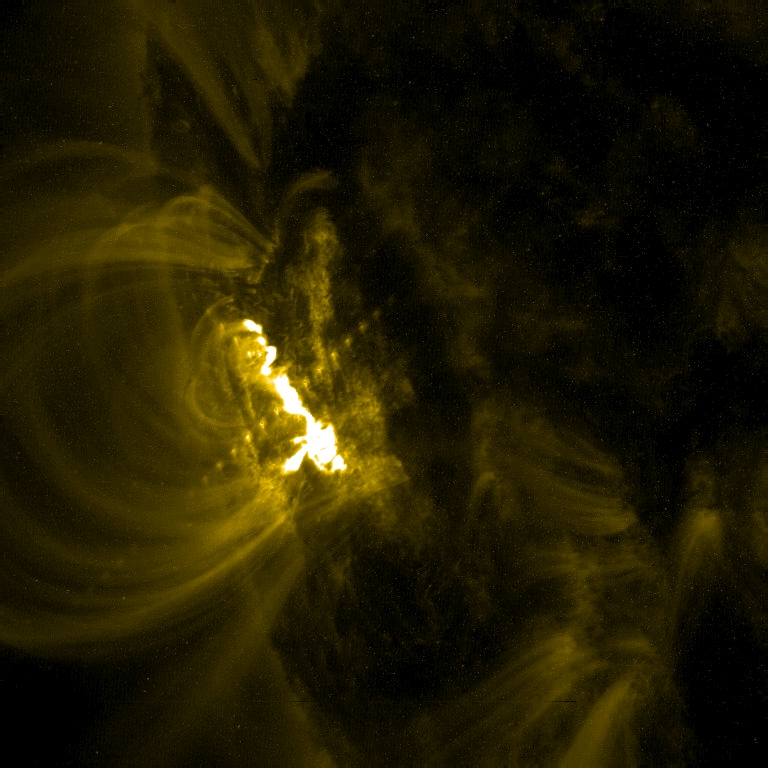
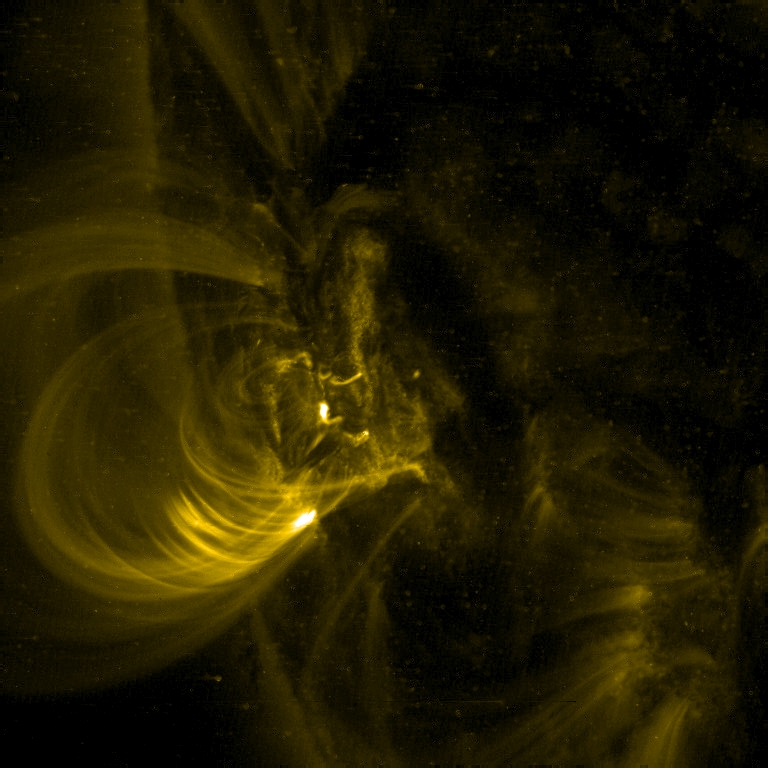
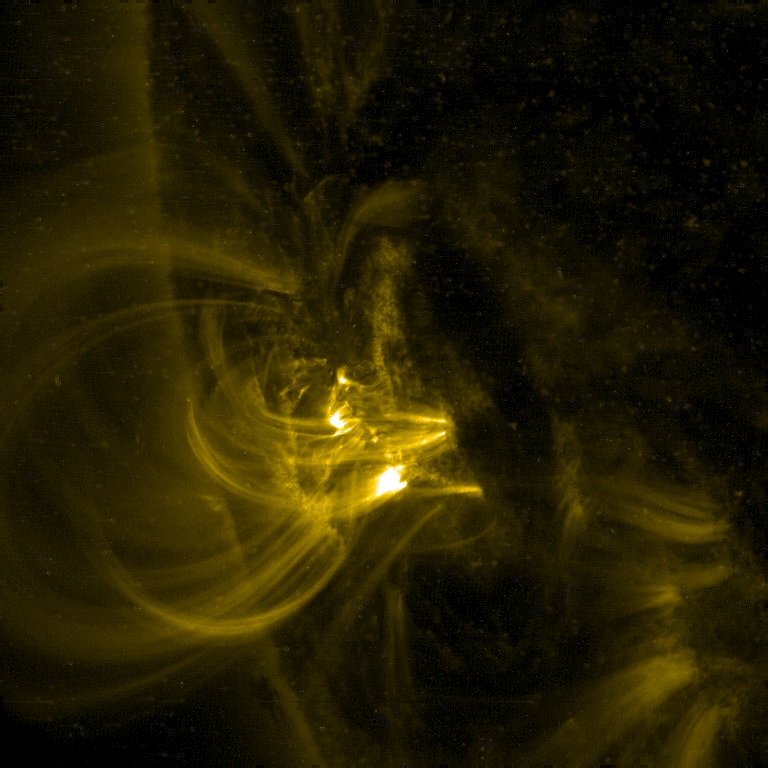
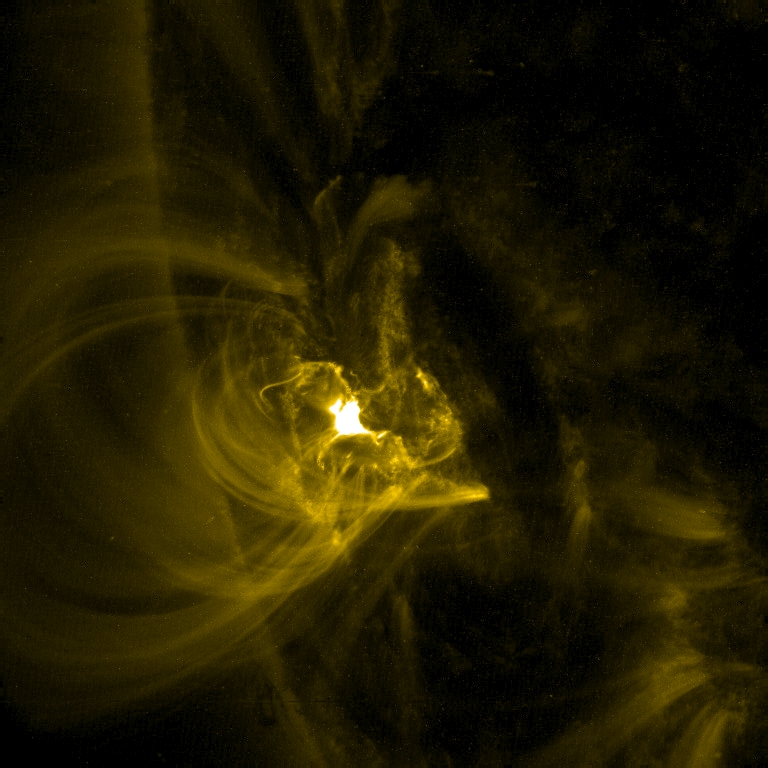
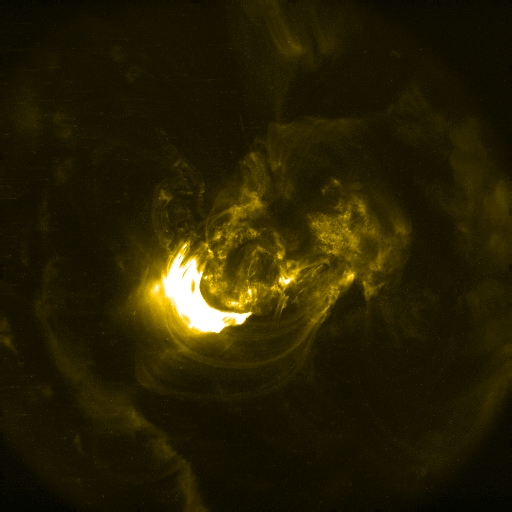
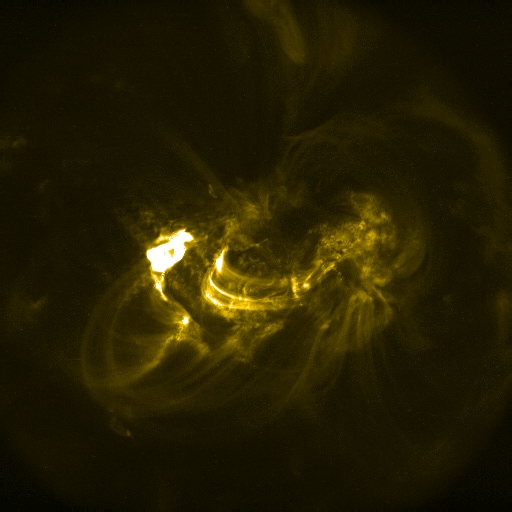
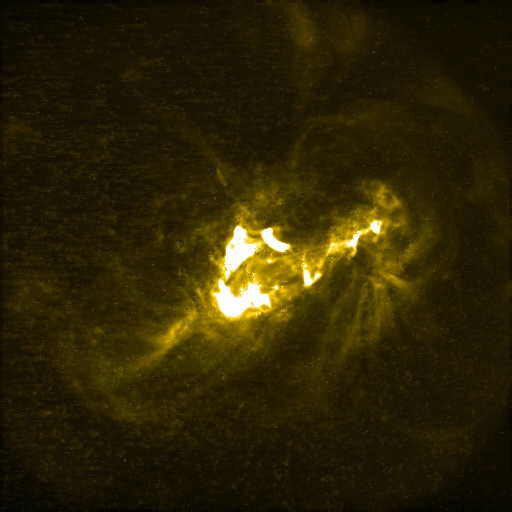
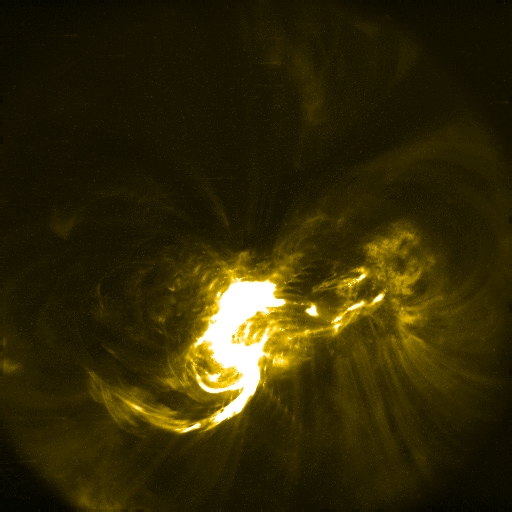
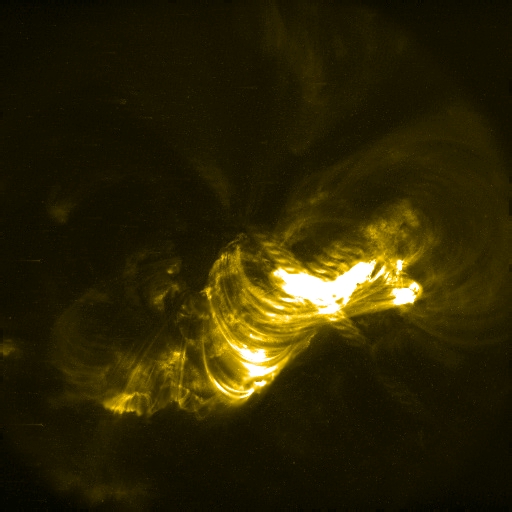
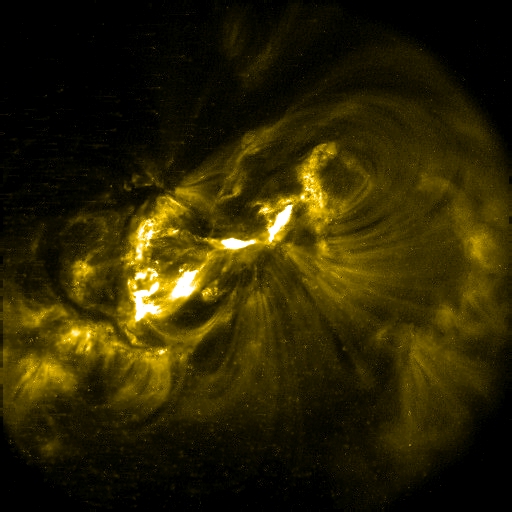
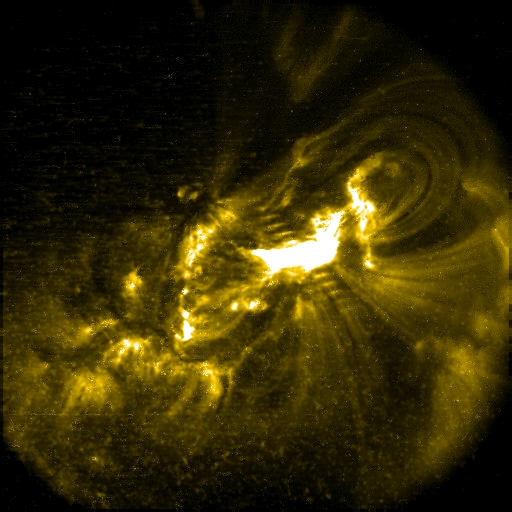
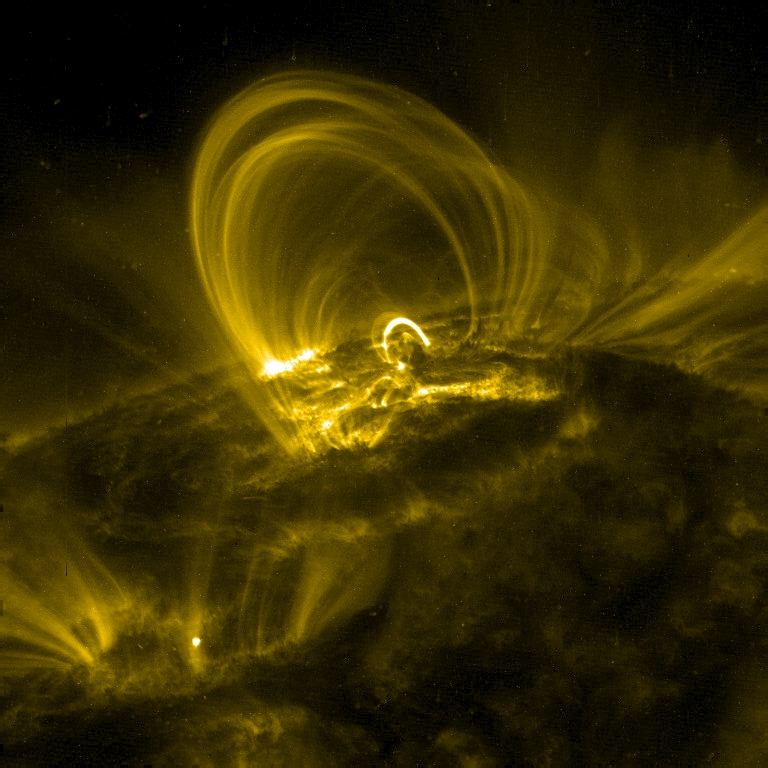 Almost as soon as Active Region 10808 rotated onto the solar disk, it spawned a major X17 flare. TRACE was pointed at the other edge of the Sun at the time, but was repointed 6 hours after the flare started. The image on the left shows the cooling post-flare arcade (rotated by -90 degrees so that north is to the right) 6h after the flare (at 00:11 UT on September 8); the loop tops still glow so brightly that the diffraction pattern repeats them on diagonals away from the brightest spots. Some 18h after the flare, the arcade is still glowing, as seen in the image on the right (at 11:42 UT on September 8). In such big flares, magnetic loops generally light up successively higher in the corona, as can be seen here too: the second image shows loops that are significantly higher than those seen in the first. Note also that the image on the right also contains a much smaller version of the cooling arcade in a small, very bright loop low over the polarity inversion line of the region. Click here for a listing (with links) to all the X
and M class flares from AR10808.
|
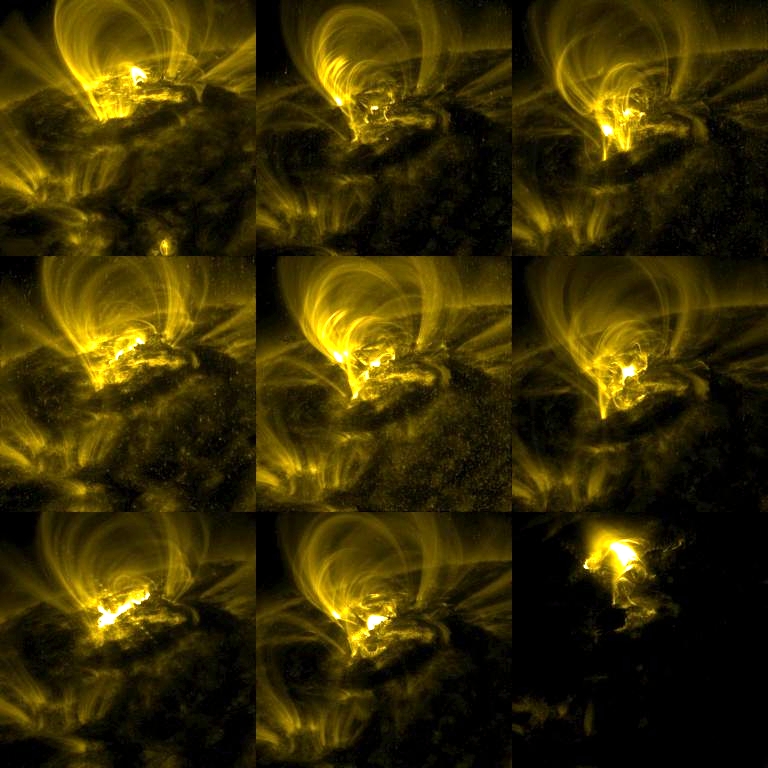 |
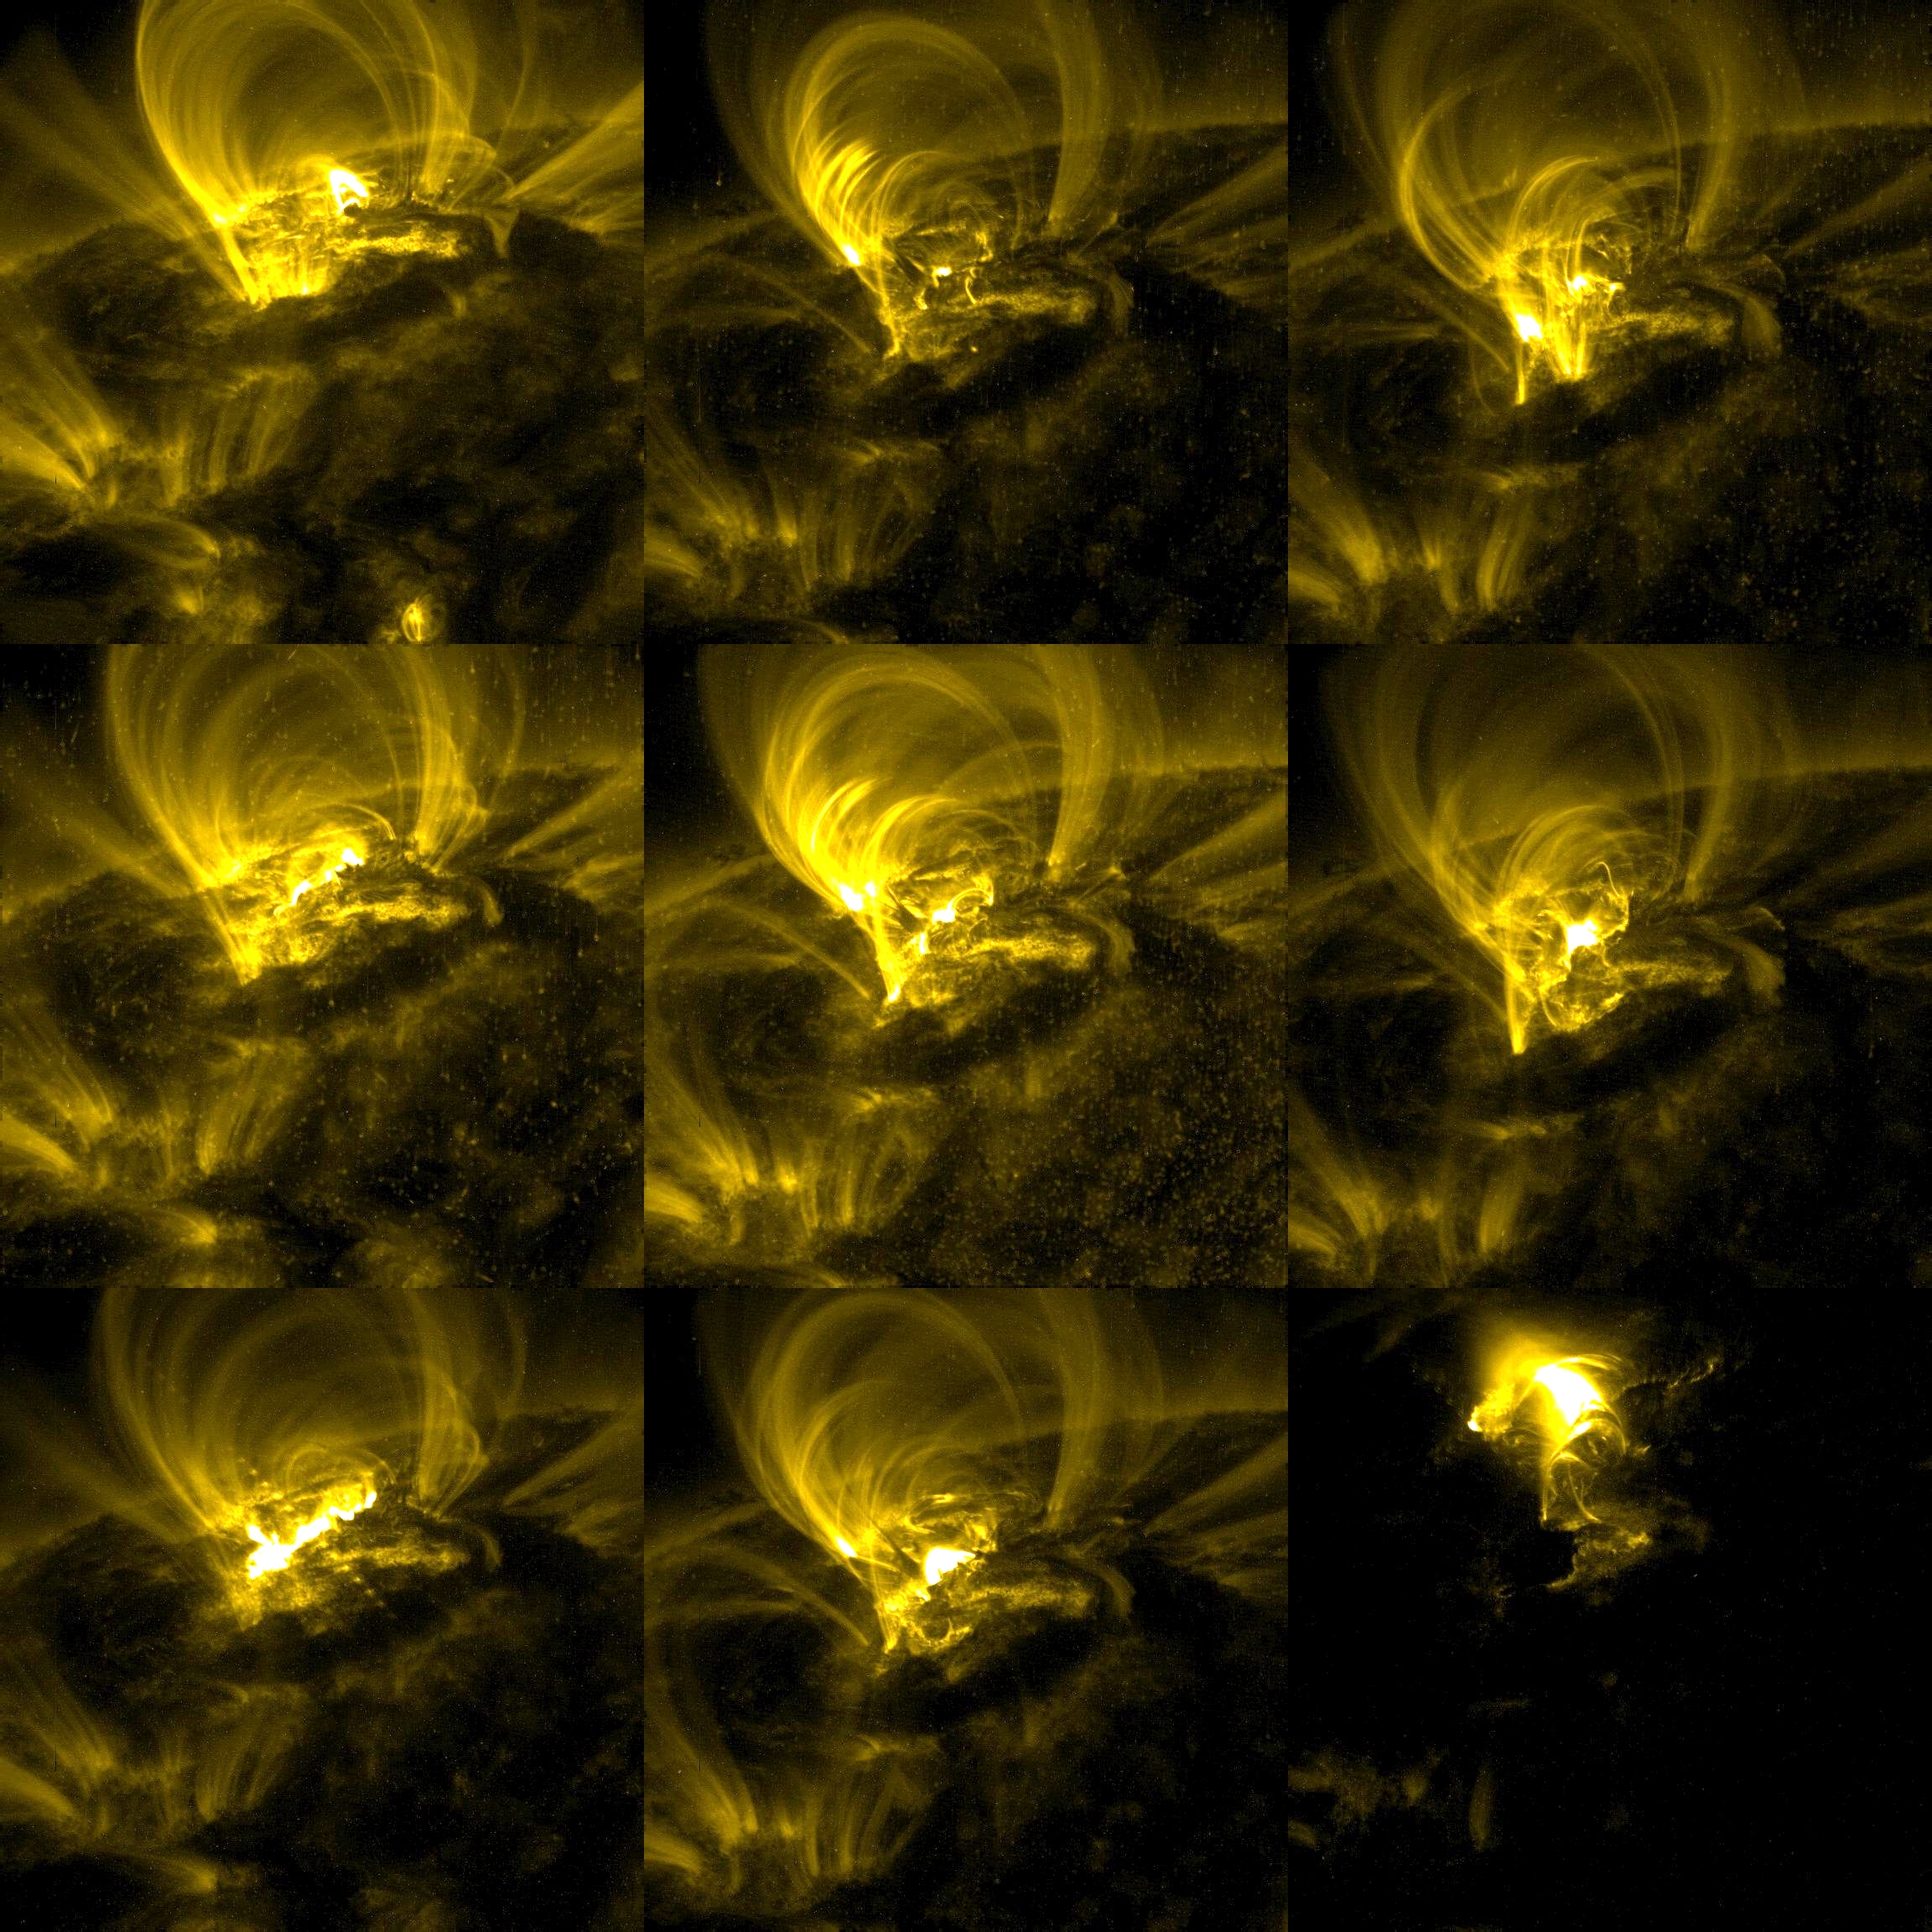
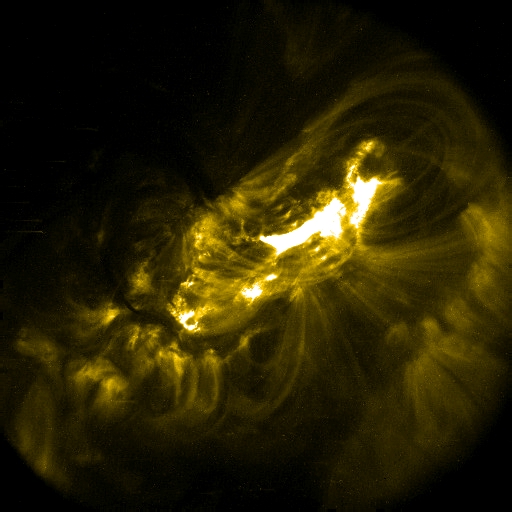
A record: most major flares in sunspot cycle 23:XXXXXXXXXXMMMMMMMMMMMMMMMMMMMMMMMM Active Region 10808 has been a big surprise: this region, in the middle of solar minimum just as we thought solar activity was going to be low for a while, has presented us in a 11-day period with 10 X-class flares and 24 M-class flares. The image shows a composite of the first 9 flares observed by TRACE (M2, M2, X5, M1, M1, X1, M2, M6, X6) on 2005/09/08 and 2005/09/09 when the region was still near the eastern limb of the Sun (click here for a full-resolution version of 2304x2304 pixels). Each of the images was taken near the peak brightness in hard X rays as seen by the GOES satellite, which means rather early for the most spectacular TRACE images of the loops that form past the impulsive phase. But this composite shows where the flares started: notice how similar the magnetic configuration is, despite the repeated, disruptive flaring. Active Region 10808 certainly deserves a place among the top flare producing active regions on record, with 13 major flares (i.e., M5 or greater), which is more than any other region in the currently ending Solar Cycle 23, and puts it in fourth place in recorded history. Powerful AR 5395 (March 1989) still holds the overall record with 20 major flares. AR 433 (July 1974) produced 17 major flares (note that AR 10808 produced a "double-peak" X1 flare on 12 September that went into the record as a single event; if we count these two separately, then AR 10808 would equal the recordholder AR 5395 in terms of the total number of 11 X-class flares). Region 3763 (June 1982) is in third place with 15 major flares. After fourth place AR 10808 we then find AR 5312 (January 1989) with 17 major events, AR 6659 (June 1991) with 12 major flares (five X-class flares saturated the XRS sensor at X12, while the sixth X-class flare was an X10), and AR 10486 (October 2003) with 12 major flares (including the largest flare on record - the X28 on November 4). [Statistics Courtesy of Bill Murtagh from NOAA's Solar Environment Center] A sampling of these and images for all of the X and M class flares that TRACE observed from this region in the 171Å or 195Å channels can be accessed by clicking on the event numbers in the summary table below (which lists flare data from the NOAA event listings). Click on the 'SSE' (SolarSoft Event) flag following it to access a data summary, and 'Tmovie' to access summary TRACE movies (N.B. Not all events for which TRACE data exist were processed into movies by the automatic software).
Of these 34 large flares, TRACE missed the impulsive phase of
the first (X17) flare because it was
pointed elsewhere (but was repointed 6h after the flare start to
observe the cooling postflare arcade),
missed two partly while observing in 1600Å or
171Å offset from the main flare site, for two the onboard memory
was full with information on earlier flares, while for two
(marked *) the data was lost in transmission between the satellite and
the TRACE computer system. But 27 of these large flares were observed
by TRACE in either the 171Å or 195Å channels; sample
images taken near the hard X-ray flare peak can be viewed by clicking
on the event numbers in the above table (note that the file names
contain pass band, date, and time information).
|
 |
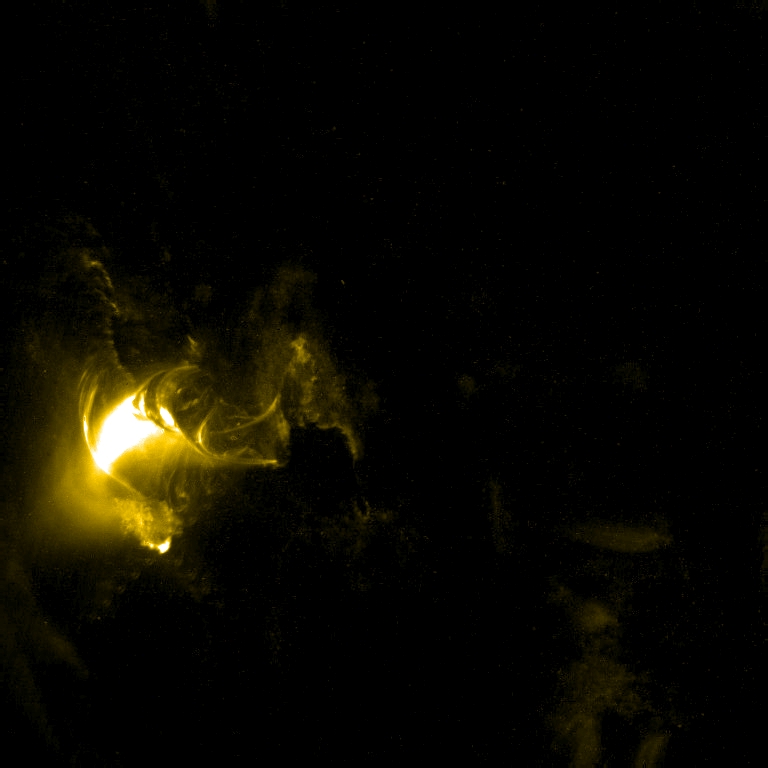
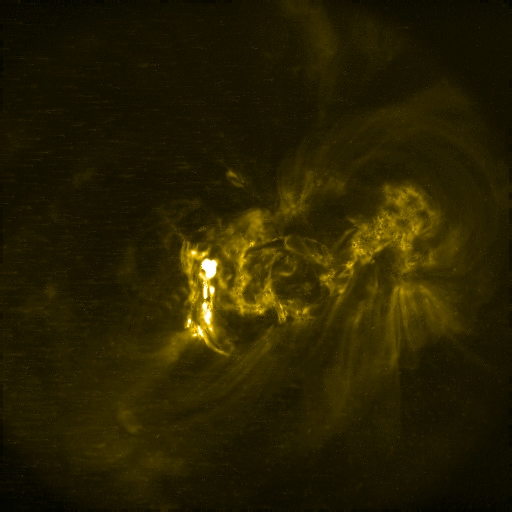
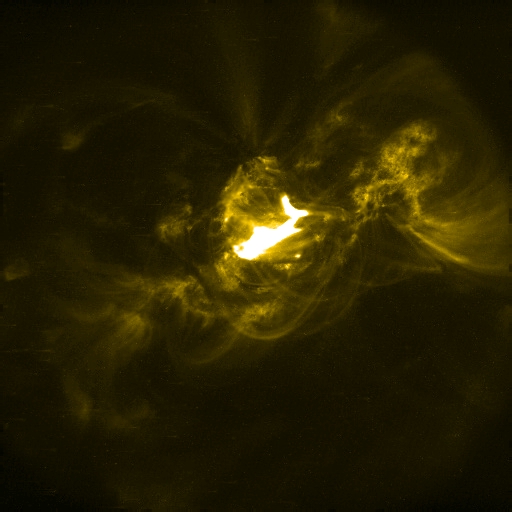
XXXXXMMMMMMM...Active Region 10808 has been a big surprise: this region, in the middle of solar minimum, has thus far treated us to 5 X-class and 7 M-class flares (see part of the X-ray light curve observed by GOES here). TRACE has observed all these but one of the X flares and one of the M flares. One image is shown on the left; more will be shown here later ... Normally, solar energetic particle (SEP) events associated with
disturbances in the eastern hemisphere are characterized by slow onset
and lack of high-energy particles. The SEP event associated with the
first major flare (X17) is shown in this image; it is among very few
such events over several decades in that although the source region
was on the east limb, the particle flux started to rise only a few
hours from the flare onset, while the flux of protons with energies in
excess of 100 MeV went up by more than a factor of one hundred. We do
not understand how these energetic particles can reach the Earth from
that side of the Sun, because there should be no magnetic
connectivity.
|
  |
When do electrical currents (and flares) occur in the Sun's atmosphere?NASA press release 2005/08/16Strong electrical currents in the Sun's corona form when new field, itself likely carrying currents, emerges into existing active regions out of alignment with existing field (see this study published in the Astrophysical Journal (ApJ 628, 501; July 2005). The visualizations on the left (courtesy Goddard Space Flight Center, based on SOHO/MDI and TRACE observations), show the characteristic differences between regions with and without strong electrical currents. The movies first show the evolution of the magnetic field (observed with SOHO/MDI), then a computed current-free (potential) magnetic field, and finally the subsequent evolution as seen by TRACE in its 171Å pass band. In
the top movie, the computed field shows little
resemblance to the coronal
configuration observed with TRACE (gold color table); the strong currents
responsible for this deviation between field and model caused very
strong flaring activity in this region. In the bottom movie, the
model field matches the corona quite well, and although there is
considerable coronal variability, no major flaring occurred. The
magnetogram movies differ in that the potential case shows some
emerging flux, but relatively little, and mostly aligned with the
pre-exising field. The non-potential case shows strong intrusions of
misaligned, rapidly evolving field with very strong gradients. The
latter characteristic is shared by almost all of the non-potential,
flaring regions analyzed in the ApJ study.
|
 |
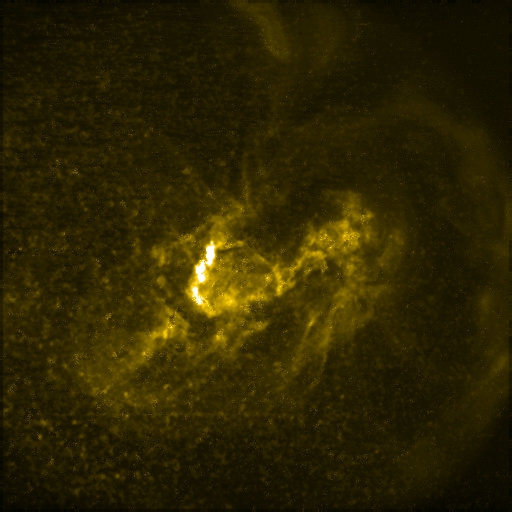
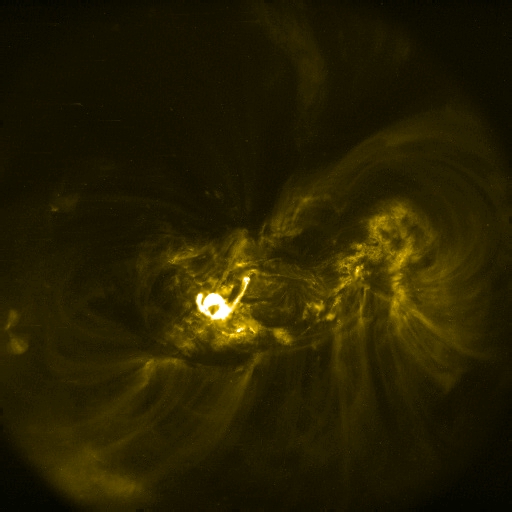
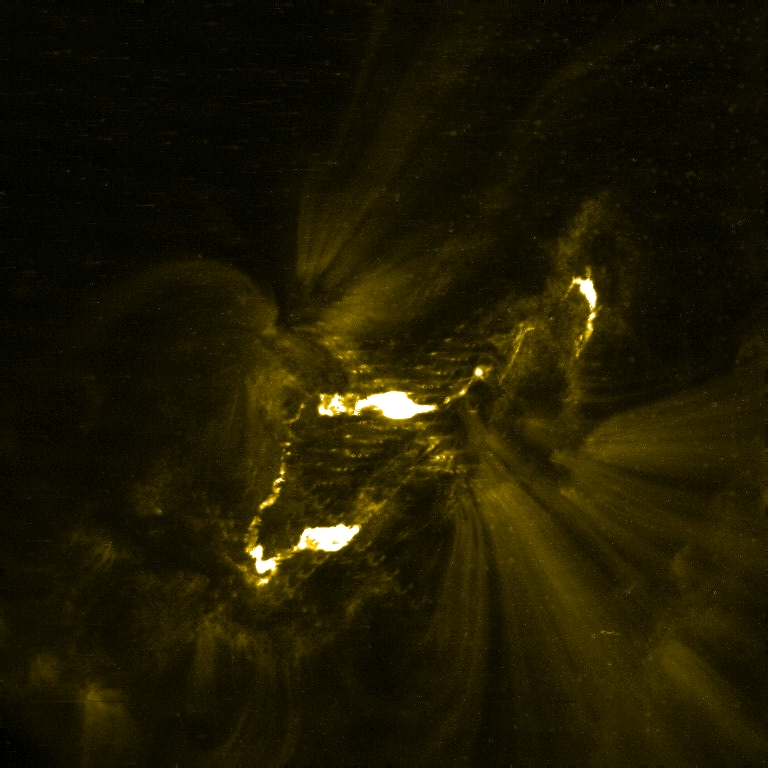
TRACE observed the onset and evolution of an X1.3 flare in AR10792
in the morning of 2005/07/30.
This 6-hour
movie (21MB), taken
in the 171Å channel, shows the evolution between 03UT and 09UT.
The first two hours show the evolution of the northern filament (on the
right in these images that were rotated by 90 degrees clockwise). Then,
around 05UT, the lower (left-hand) filament erupts, throwing cool,
chromospheric material upward, which shows the twisting evolution
of the magnetic field before it slides down towards the limbward
side of the configuration. Then the northern (righthand) filament erupts
at the start of the hard X-ray flare around 06:20UT.
|
|
| Home | Mission | Instrument | Team | Operations | Results | Images | Movies | Education | Site Info. | |