

The TRACE images may be used without restrictions
in publications of any kind. We
appreciate an acknowledgement indicating that
the Transition Region and Coronal Explorer, TRACE,
is a mission of the Stanford-Lockheed Institute for Space
Research, and part of the NASA Small Explorer program. More information on
TRACE and other TRACE images can be found
here.
 |
 > >
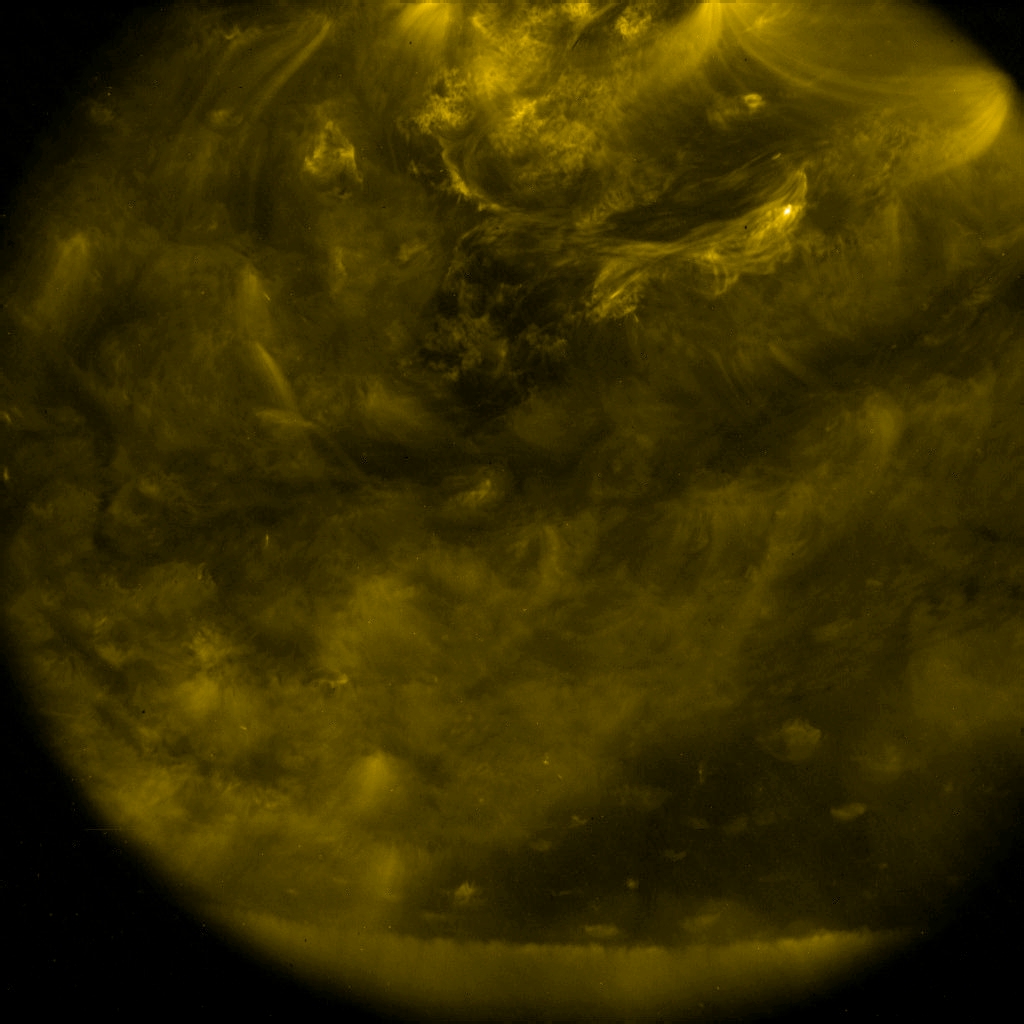
 Eclipse: 29 March 2006These images were taken by TRACE in its ultraviolet 1600Å passband around 08:04 UT on 29 March 2006 with 30s between exposures. It shows the Moon moving onto the solar disk, coming from the North and moving South. Seen on Earth, the Moon moves mostly from West to East, but because TRACE was moving from pole to pole in its orbit around Earth - compare this image showing the position of the Moon seen from TRACE in five minute intervals. (TRACE images courtesy of Dawn Myers, GSFC; the path of the Moon seen from TRACE, courtesy of Bart De Pontieu, LMSAL).For another space view of the eclipse,including a view of the shadow on the Earth, have a look at images taken from the NASA Space Station. |
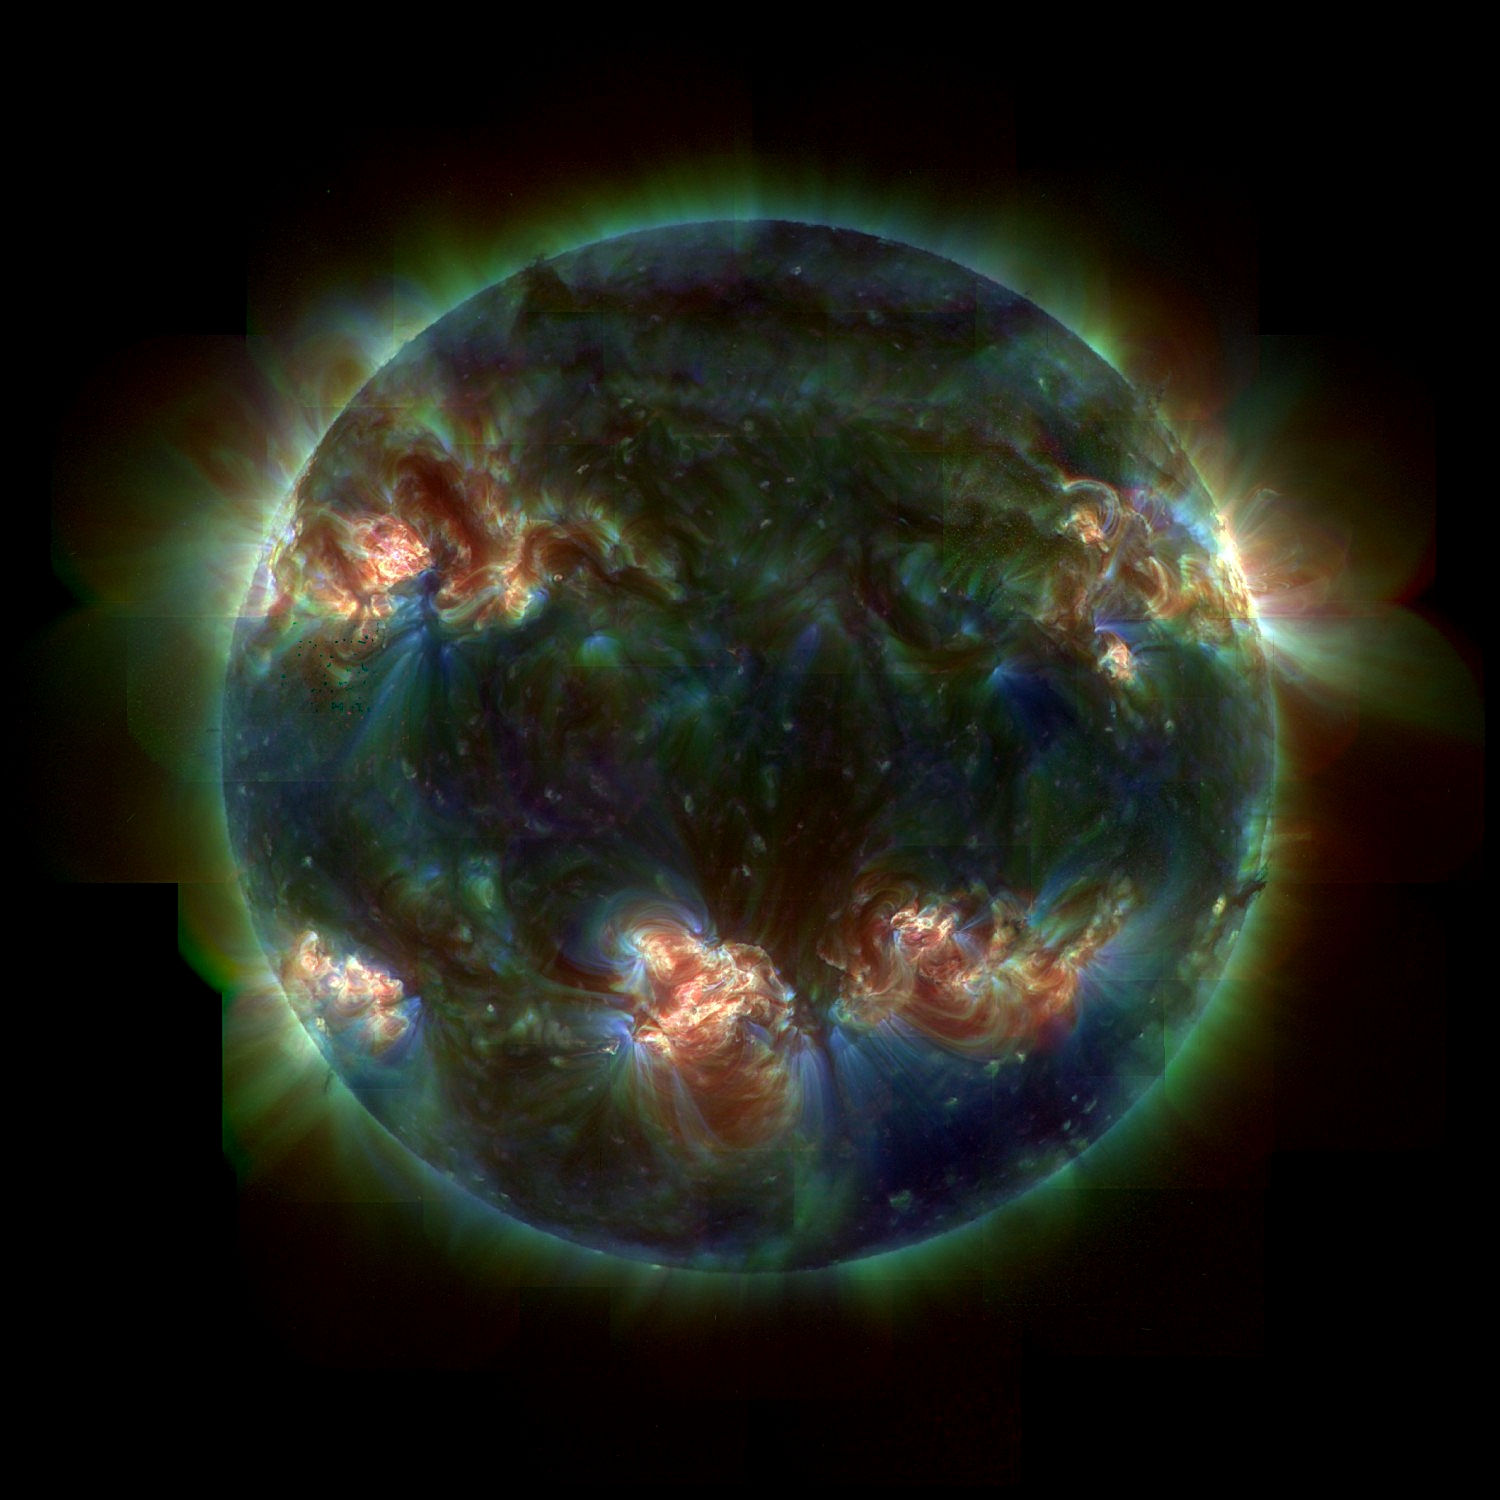 |
The big picture ITRACE's field of view covers only a fraction of the entire Sun, but by repeatedly repointing, it can create an image of the entire solar corona. This image shows the solar corona on 1999/07/30 in a false-color, 3-layer composite: the blue, green, and red channels show the 171Å, 195Å, and 284Å, respectively (most sensitive to emission from 1, 1.5, and 2 million degree gases).The image (rescaled to 1500 by 1500 pixels to a side) shows the corona for a moderately active Sun, with some (red) hot active regions in both hemispheres, surrounded by the (blue/green) cooler plasma of the quiet-Sun corona. Notice also the north polar-crown filament, the trans-equatorial loops, and the coronal hole in the south-east (lower-right) corner of the image and the smaller one over the north pole. P.S. There is also a 6.9MB 4500x4500 pixel version of this image. For those interested in an annotated list of all 3EUV mosaics made by TRACE prior to 2006, click here. Astronomy Picture of the Day for 10 July 2006.
|
 |
This
QuickTime movie (20MB)
shows a filament activation and B2 flare, at roughly 1-min. cadence,
from 2006/03/07 14:24 UT through 21:50 UT, observed by TRACE in its
171Å channel. The region starts out looking very quiescent,
although its non-potentiality
(pointed out in this earlier entry)
is clearly discernable in the arc of loops from the leading to following
polarity that is nearly perpendicular to the high-arching loops emanating
from the region's central domain. Then a filament-like field configuration
is activated, running to the bottom-left from the active region, and
seems to roll and unwrap in the process. As the arc of nonpotential
loops begins to move upward, weak flare ribbons form under the activated
filament-like field, followed by the formation of post-flare loop arcades.
Towards the end of the movie, the region looks to be largely potential,
so we expect no further substantial activity from it. Note the
dimming of much of the corona towards the lower left of the active
region as the eruption progresses. The
field of view is 960x720 pixels (scaled down by a factor of 1.5 to a
640x480 movie).
|
 |
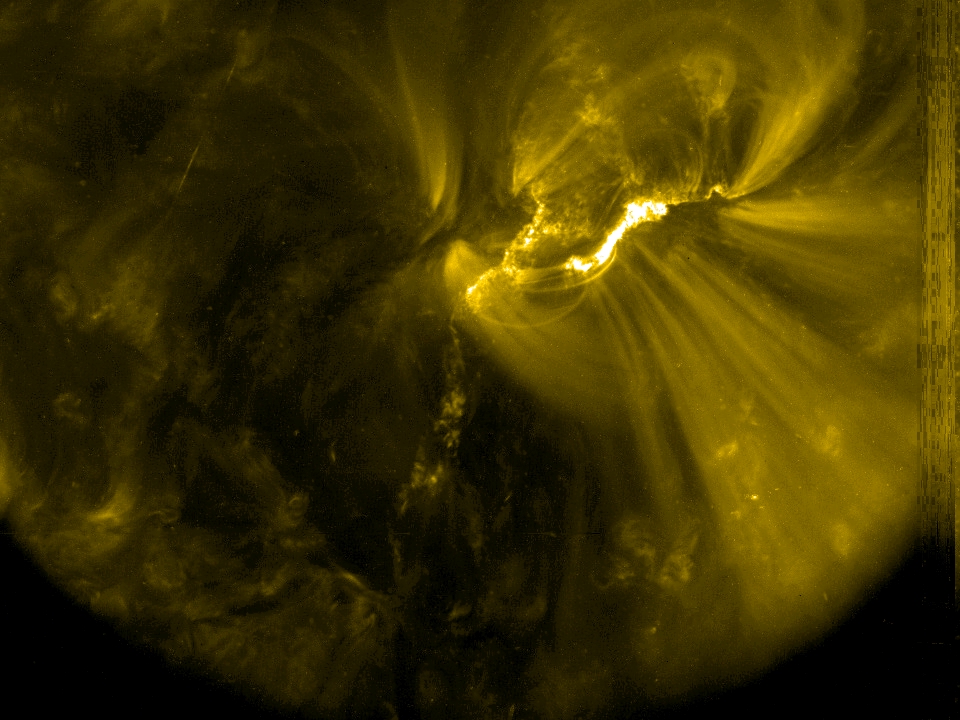
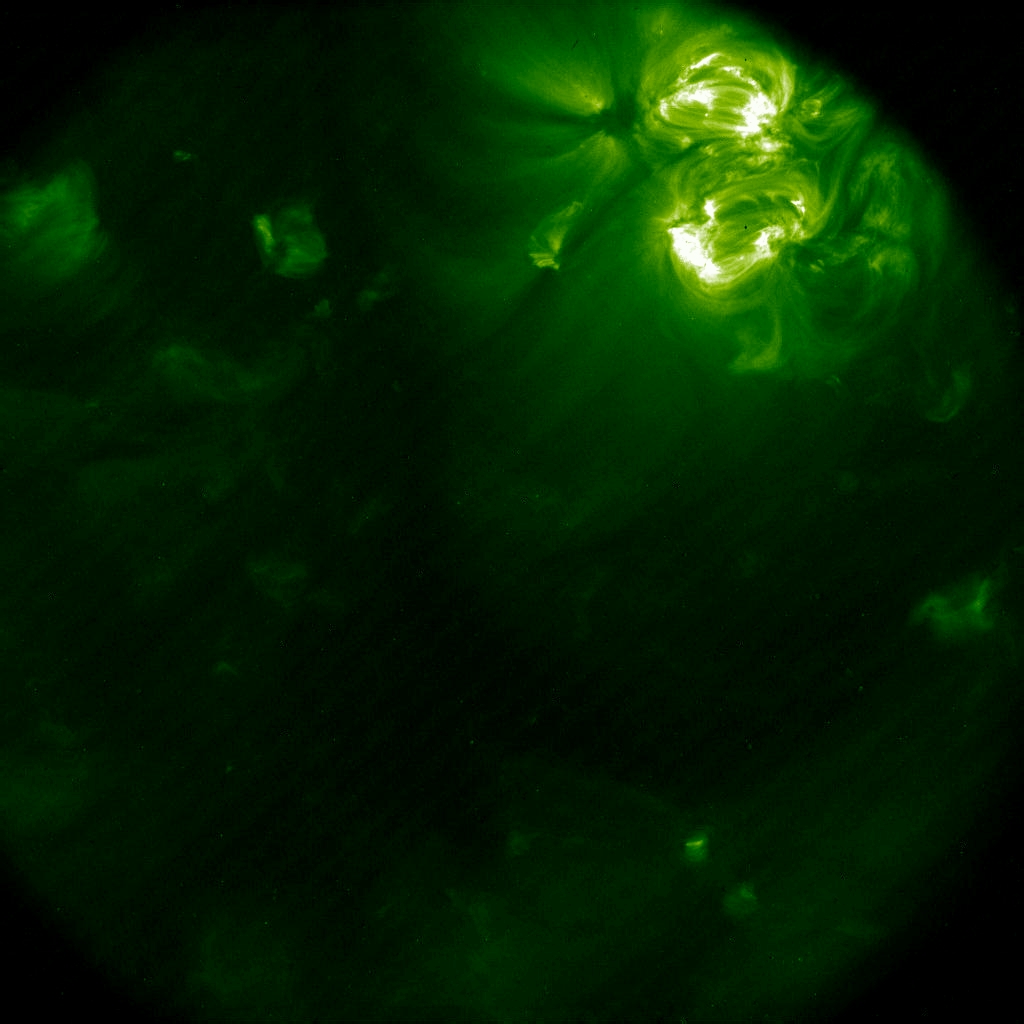
With the Sun in its cycle minimum, there was only one substantial active region
on the disk on 2006 March 6. This image shows AR10856, a region of
average size, already breaking up, and ready to disperse its magnetic
field across the solar surface. Yet, this tired old region remains
interesting. The TRACE 171Å images show pronounced loop systems
emanating from the main field concentrations in the leading and following
polarities ... but without any sign of sunspots or pores in the
SOHO/MDI visible-light image. The region also appears to
carry strong electrical currents, or at least so we think because of
the nearly perpendicular loops systems that we see just below the center
of the 768x768 pixel (375km each) field of view. And a movie of this
active region over several days reveals pronounced ongoing waves propagating
up into the corona along the strong-field loop systems over the leading
and following polarities. Where do all these loops go that leave the
small field of view? See the
TRACE 171Å full-disk mosaic.
|
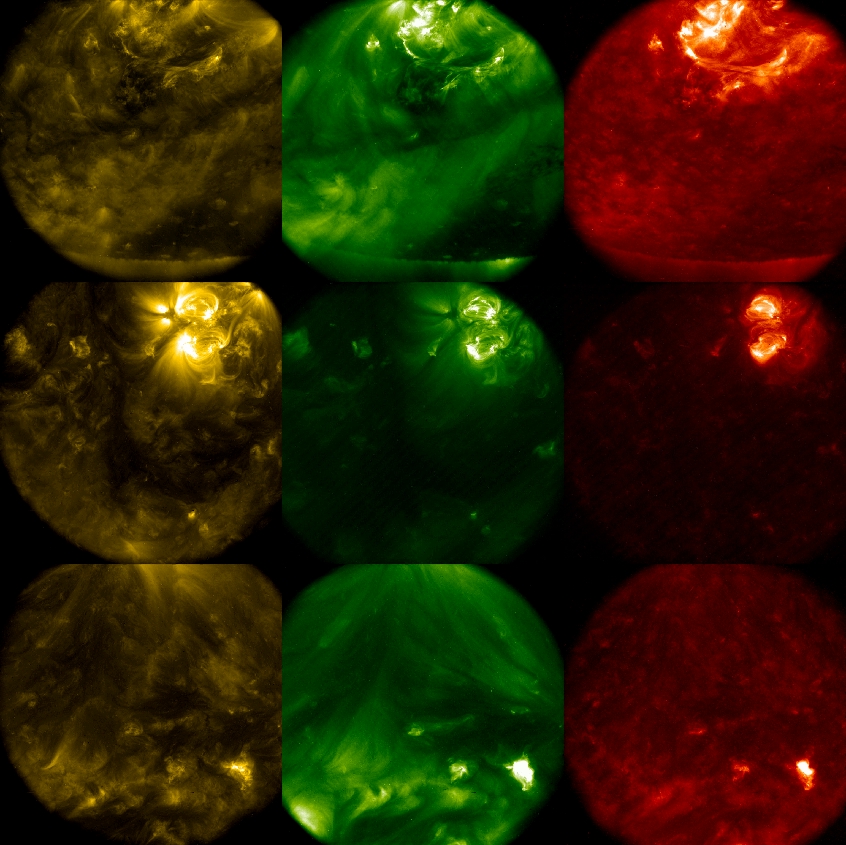 |
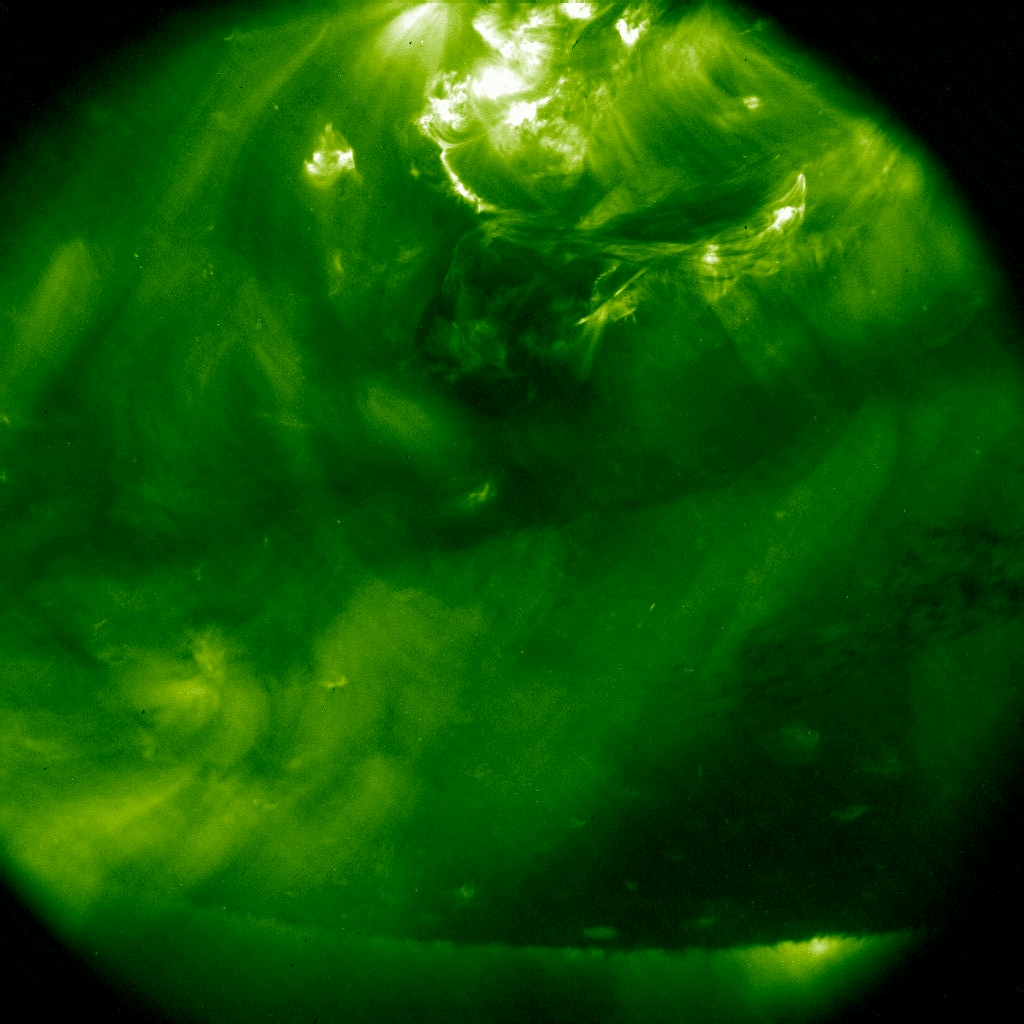
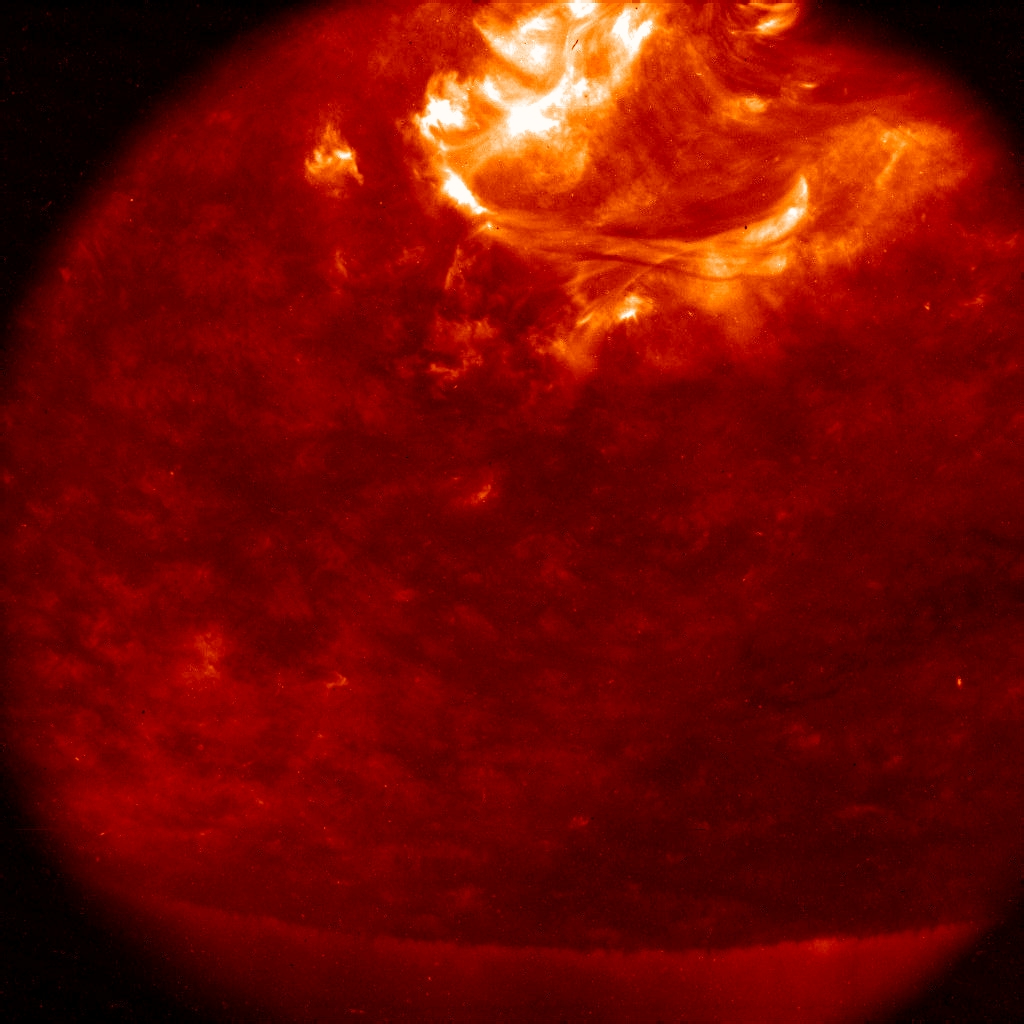
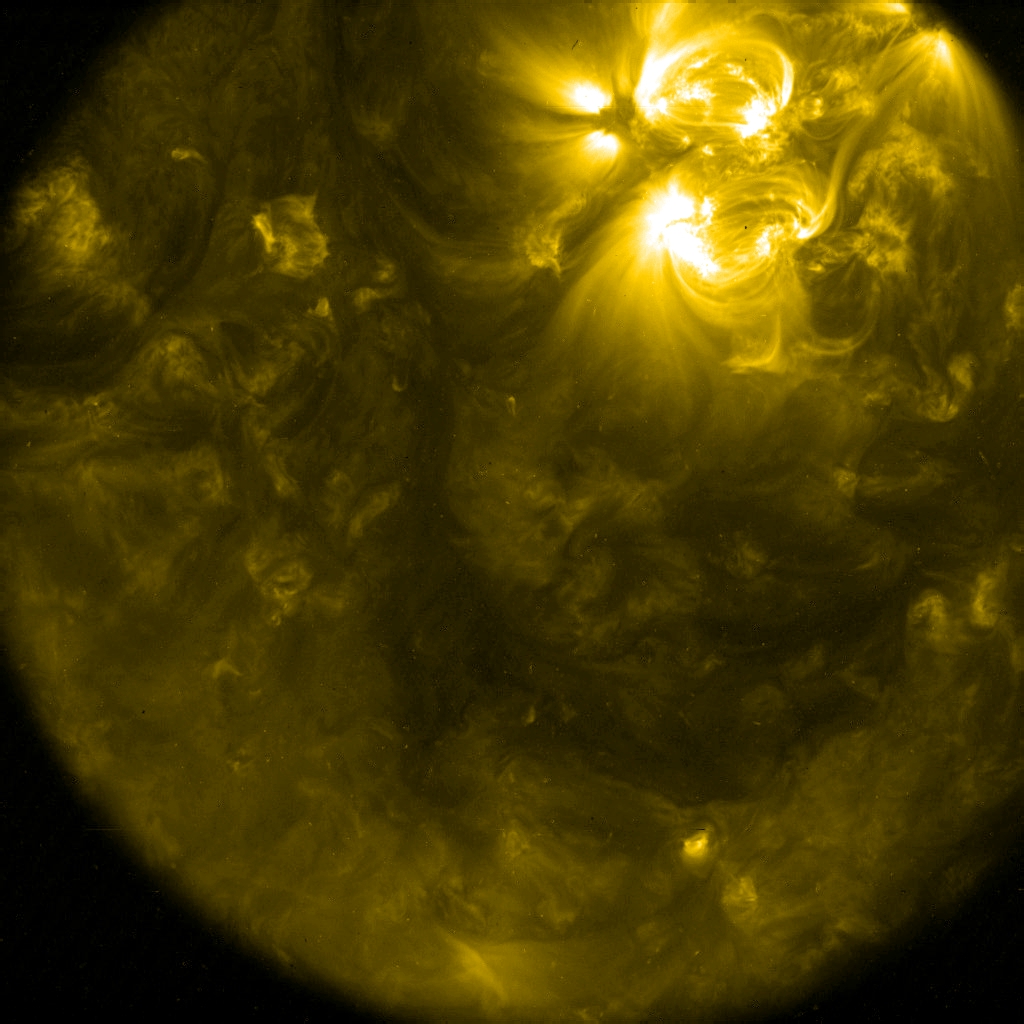
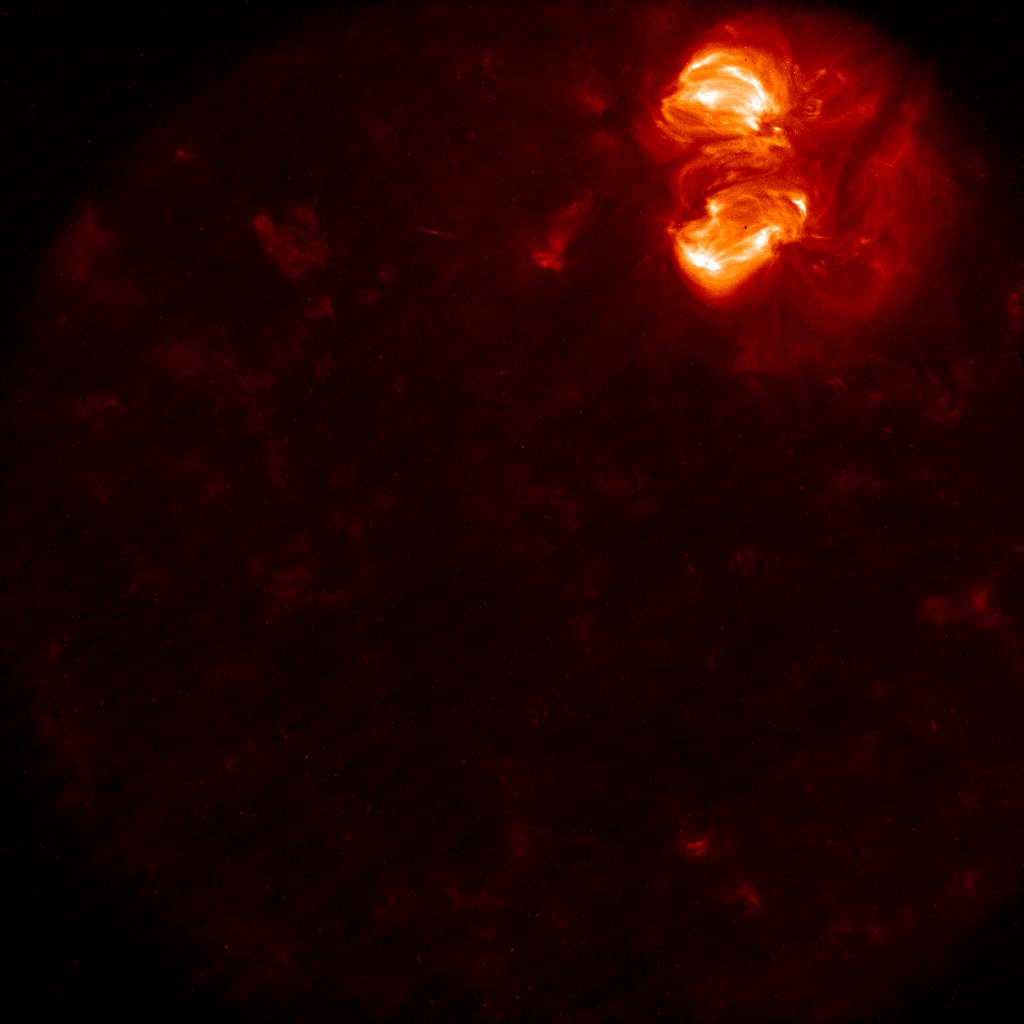
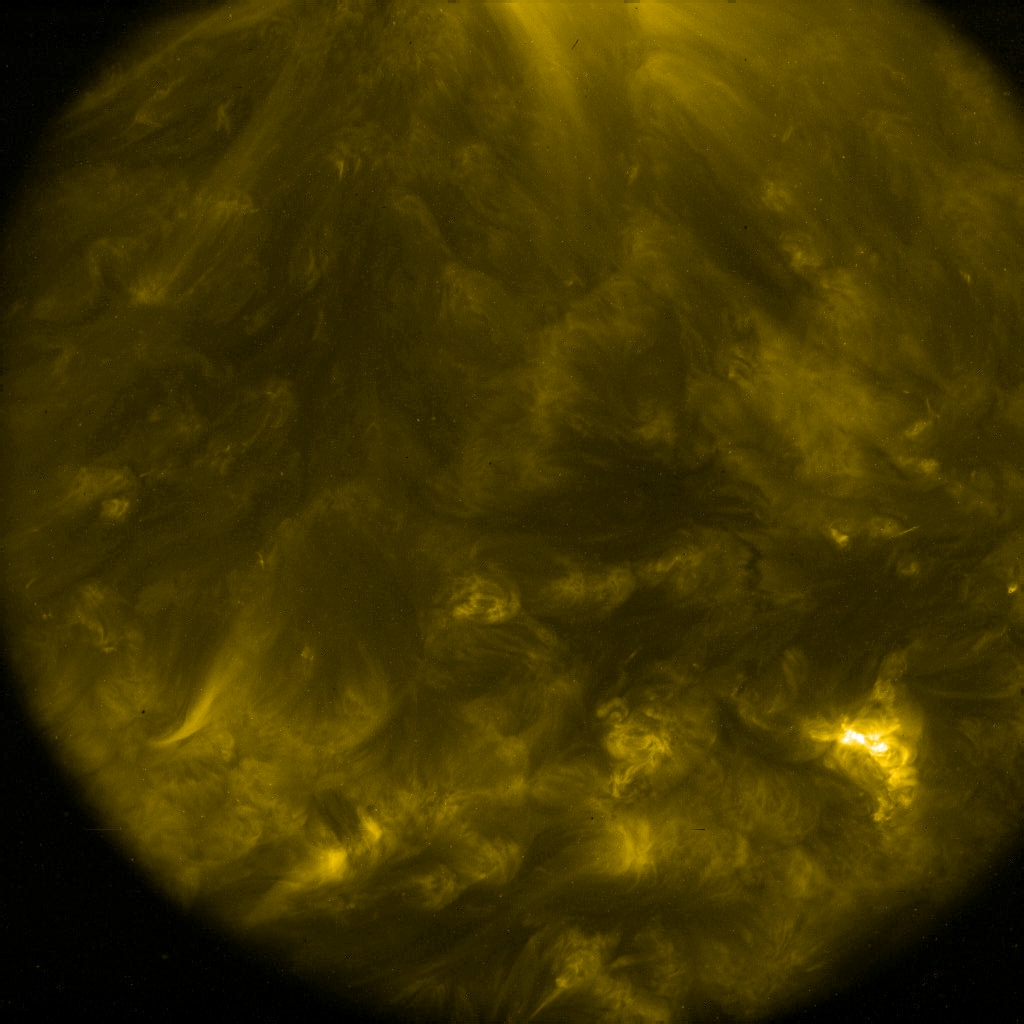
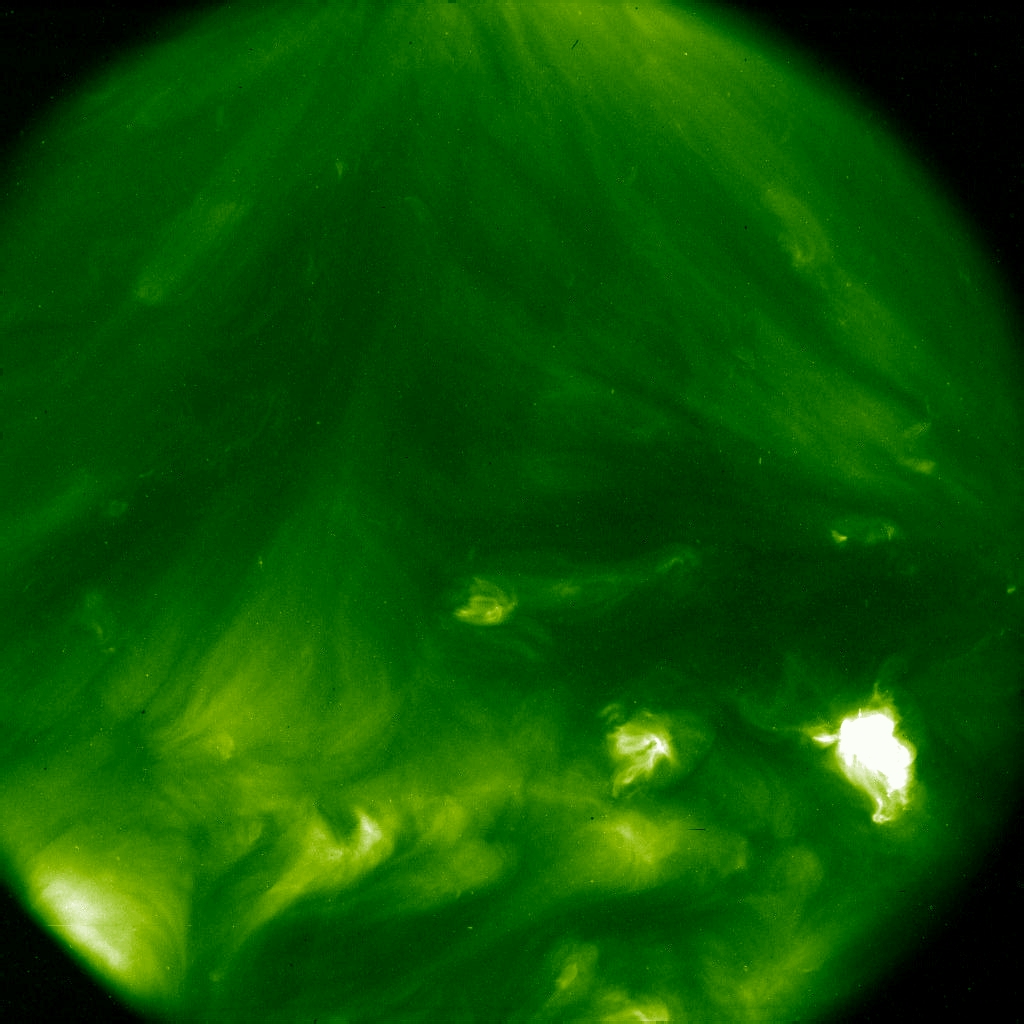
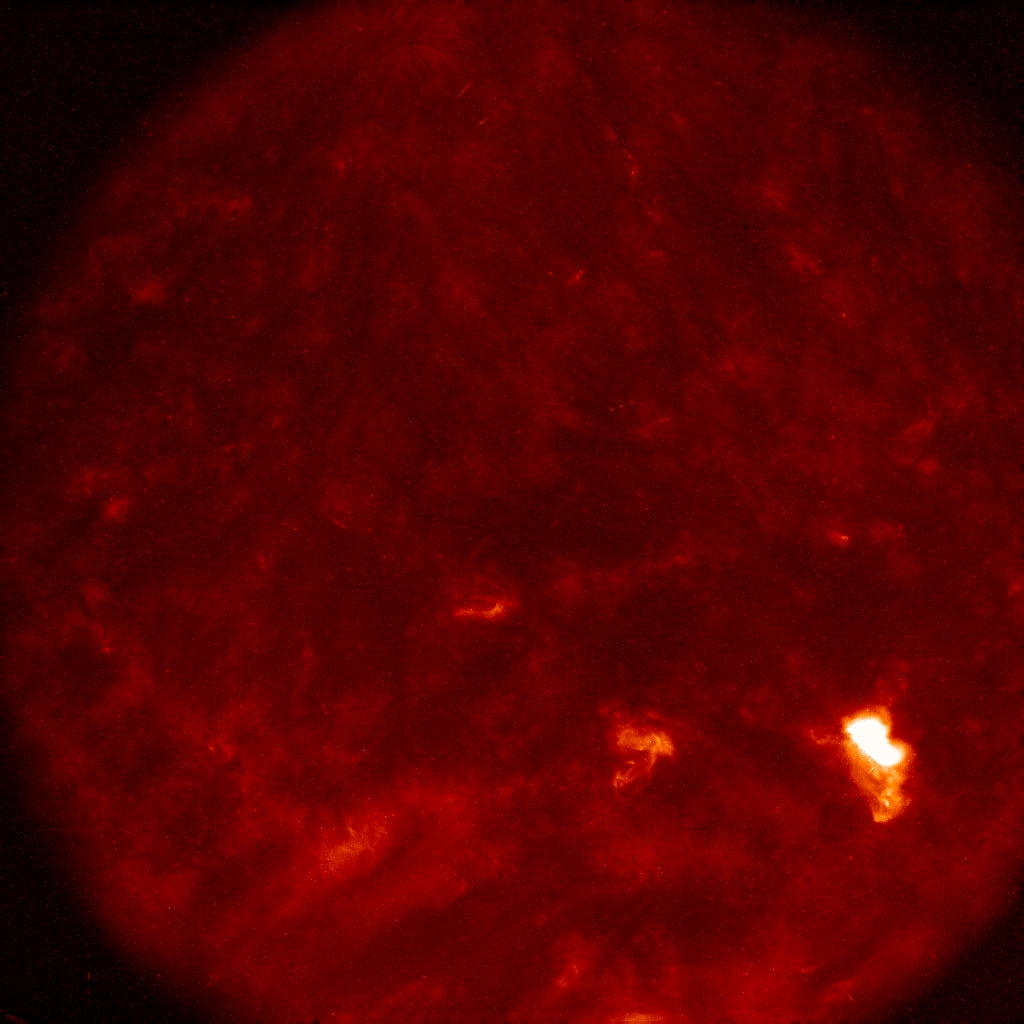
TRACE can observe the corona in three separate coronal pass bands:
the 171Å (1MK; shown in yellow), 195Å (1.5MK; green),
and 284Å (2MK; red). This composite image shows three such sets,
each composed of relatively long exposures (ranging from 20 to 260 seconds,
longest for the 284Å channel). At the top (images 1,2,3) we
see the solar south polar region, with a filament running diagonally
through the image and with an active region just at the upper edge of
the field of view. The central row (4,5,6) sows a region near the center
of the disk, again with a filament and a compact active region, surrounded
by quiet Sun. The bottom row (7,8,9) shows a very quiet region with
strands of filaments, long loops, and compact ephemeral regions. The
intensities in each have been scaled logarithmically to cover the large
dynamic range in these exposures. The original images are all 1024 by
1024 pixels of 375 km to a side; these can be accessed here:
1,
2,
3,
4,
5,
6,
7,
8,
9 (note that
the exposure dates and times are contained in the names of the files).
Comparing these images shows many differences reflecting both the field
geometry and the thermal structure of the quiescent corona.
|
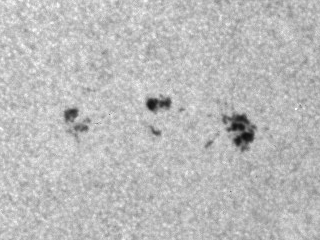 |
This 5-day
QuickTime movie (0.5MB), taken
in the visible-light (WL) channel (2006/01/15 04:56UT -
2006/01/20 19:32UT), shows the evolution of a small spot group from
emergence to decay. The movie starts as TRACE observed the
first signs of magnetic-field emergence and pore formation. As time
proceeds, pores form groups and migrate and regroup, eventually
forming a small leading sunspot (with penumbra) early on January 17. But
shortly after it forms, it begins to disintegrate, and fades into
the faculae (increasingly visible as the region approaches the solar limb)
by the middle of January 19. The trailing pore cluster never forms a
real sunspot, and fades into the facular field about a day later.
|
 |
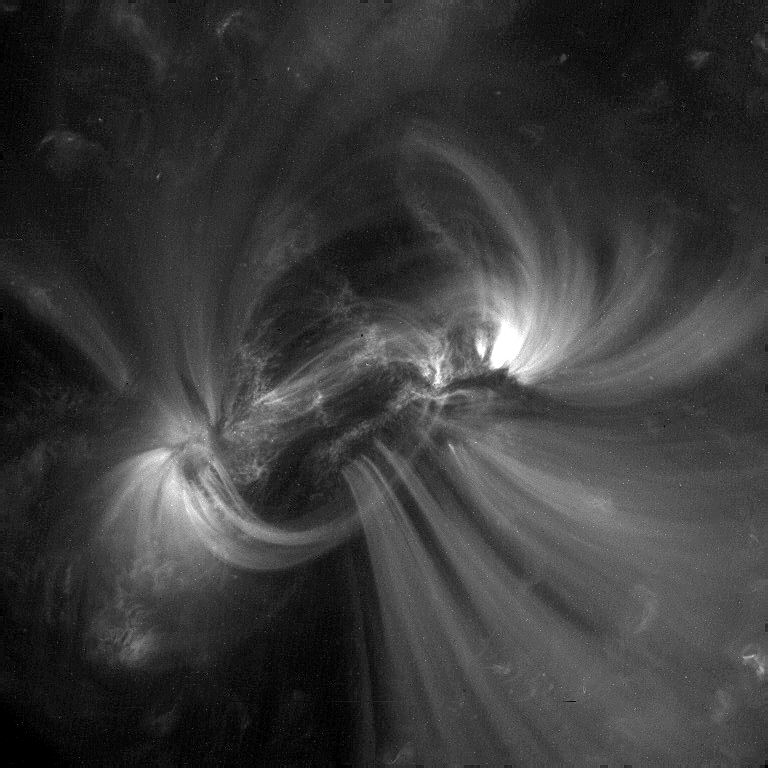
This TRACE 171Å image, taken on 2005/12/07 at 02:37 UT, shows
Active Region 10826 ahead of a much smaller neighbor as it approaches
the western solar limb. Among the many loops that arch over AR10826,
some on the righthand, leading side of the region stand out because
they are dark rather than bright. These structures persist for days,
although they do evolve so that it is hard to say if from one hour
to the next we are looking at the same magnetic structures or whether
new adjacent fields have taken on their properties. As we see no
indications of material flowing along the loops, we take them to be
dark because they are virtually empty, not because cool absorbing material
flows along them. What makes the especially interesting, is that we can
trace them from near the solar surface to their apex and perhaps beyond,
and we can see them expand with height. This is an interesting contrast
with the bright loops that have been measured to have nearly constant
cross sections along their lengths. These dark loops may help us understand why
the bright loops do not expand with height even though we would expect them
to.
|
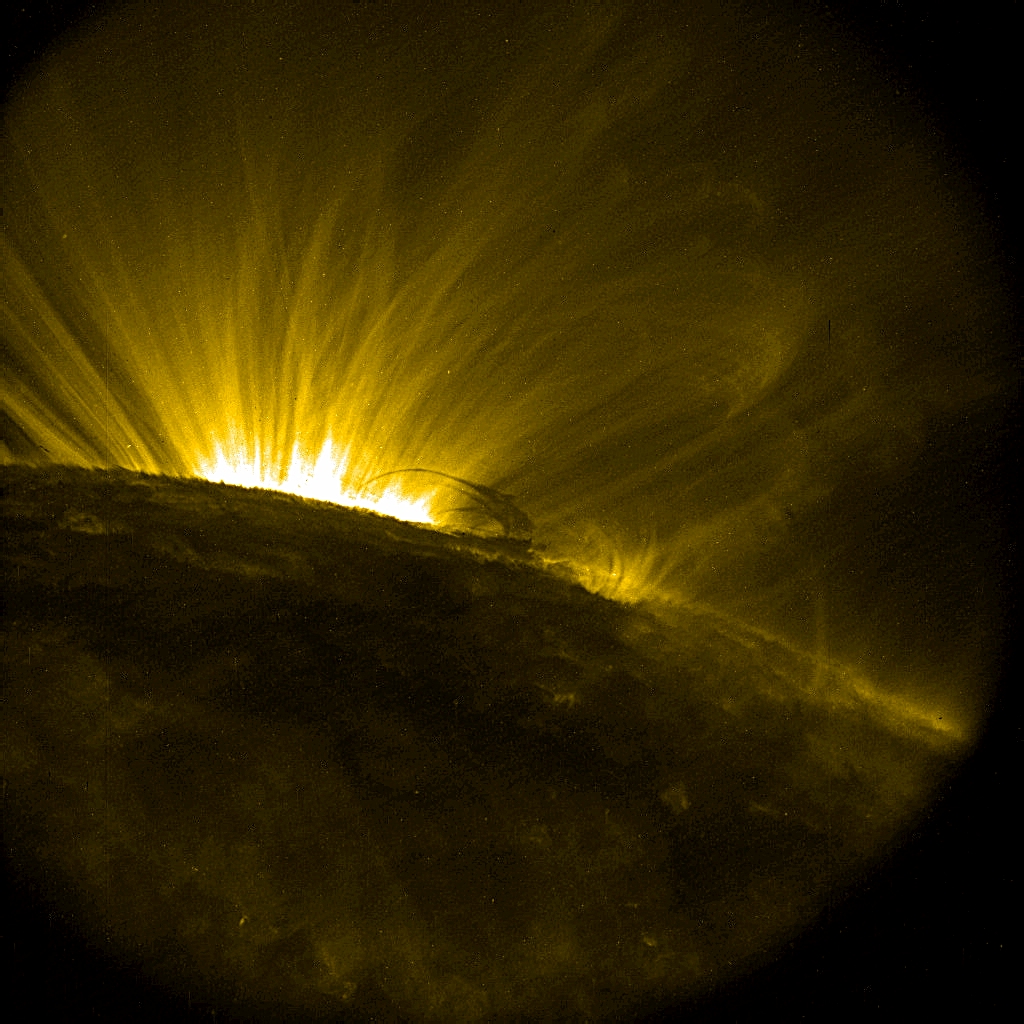 |
This image, taken by TRACE on 21 September 2005, at 03:27 UT, shows bright,
high active region loops above the solar limb. With the active region rotated
off the visible hemispere of the Sun, only the high-arching coronal loops
remain visible.Seen in projection against that, is a filament that trails
the active region. In this image, several thin, dark strands are seen; these
are filled with relatively cool material that absorbs the extreme
ultraviolet emission from the bright loops behind the filament. The material
can be seen to be in continual motion. The entire filament
destabilizes in a flare-like eruption just over an hour after this picture
was taken, but things settle back again and the filament lives on.
|
Large files:  QT files  DVD img files Short (POD) movies:  POD listing |
200+ GigaBytes of TRACE movies in QuickTime or DVD formatSince its launch in 1998, the Transition-Region and Coronal Explorer, TRACE, has taken over 17 million images of the Sun (as of October 2005). A selection of these images has found its way into a widely diverse set of publications, ranging from scientific studies to the printed newsmedia (and over 200 have been discussed on the TRACE home pages at http://trace.lmsal.com). Images sequences have an even greater power to surprise and enchant, as illustrated in the selection of movies on the TRACE web site. These movies were necessarily short and small, however, to allow easy downloads onto a variety of platforms. The TRACE team is pleased to announce the completion of three TRACE DVDs that together contain almost 400 movies of a variety of phenomena. They are arranged into three themes: active regions, flares, and filaments (with a few quiet-Sun bonus movies on-line only). The individual movie files are available on-line as QuickTime movies. Altogether, the movies claim over 200 GB of disk space, with individual file sizes ranging from a few MB up to 4 GB. The DVD img files (1.5-3.6 GB) are also available on-line; these may be downloaded and played, or burned onto DVD, using machines that are capable of DVD playing and writing (a fourth DVD img file contains SOHO/MDI magnetograms from launch until 2005); the DVDs show all TRACE movies in the collection, sorted by topic and date, with all materials rescaled to the available screen size of 640x480 pixels; the QT movies often show a substantial field of view with more pixels. The movies on the DVD set were compiled and produced by Alan Title,
the Principal Investigator of TRACE.
|
 |
 Late on 13 April 2000, TRACE observed a curious event, which we interpret as a filament formation (the magnetic environment is shown in the MDI magnetogram cutout above). The QuickTime (JPEG compressed) movie (3.8MB) shows a 10 hour time interval with TRACE images at about 5 min. spacing (there are many more, but the movie file would have been very large had they all been included here). Notice how a dark intrusion forms at the bottom center of the field of view. We had a hard time differentiating between two possible interpretations of the darkening: it could be an absence of emission possibly as a result of a field reconfiguration (perhaps the formation of the footprint of a newly formed coronal hole), or it could be the formation of an absorbing structure known as a filament. We decided a filament formed because of the appearance in TRACE 171Å, because the YOHKOH/SXT image gave no hint of a coronal hole forming, and because of the dynamics of the event. In case you want to compare images from these various instruments, read on: How to compare TRACE images with MDI, SXT, or a field model:Comparisons with other instruments and with field models
for all of the TRACE pointings are available in two different sets
of web pages. First, there are summary pages for every day of TRACE
observing with images of each of the observed regions in 171Å or
195&ARing;, if available. These can be accessed by typing a day
into the top-left search field on this web page, or by clicking on 'TRACEview' on the lefthand side
of this web page.
|
|
| Home | Mission | Instrument | Team | Operations | Results | Images | Movies | Education | Site Info. | |