

The TRACE images may be used without restrictions
in publications of any kind. We
appreciate an acknowledgement indicating that
the Transition Region and Coronal Explorer, TRACE,
is a mission of the Stanford-Lockheed Institute for Space
Research, and part of the NASA Small Explorer program. More information on
TRACE and other TRACE images can be found
here.
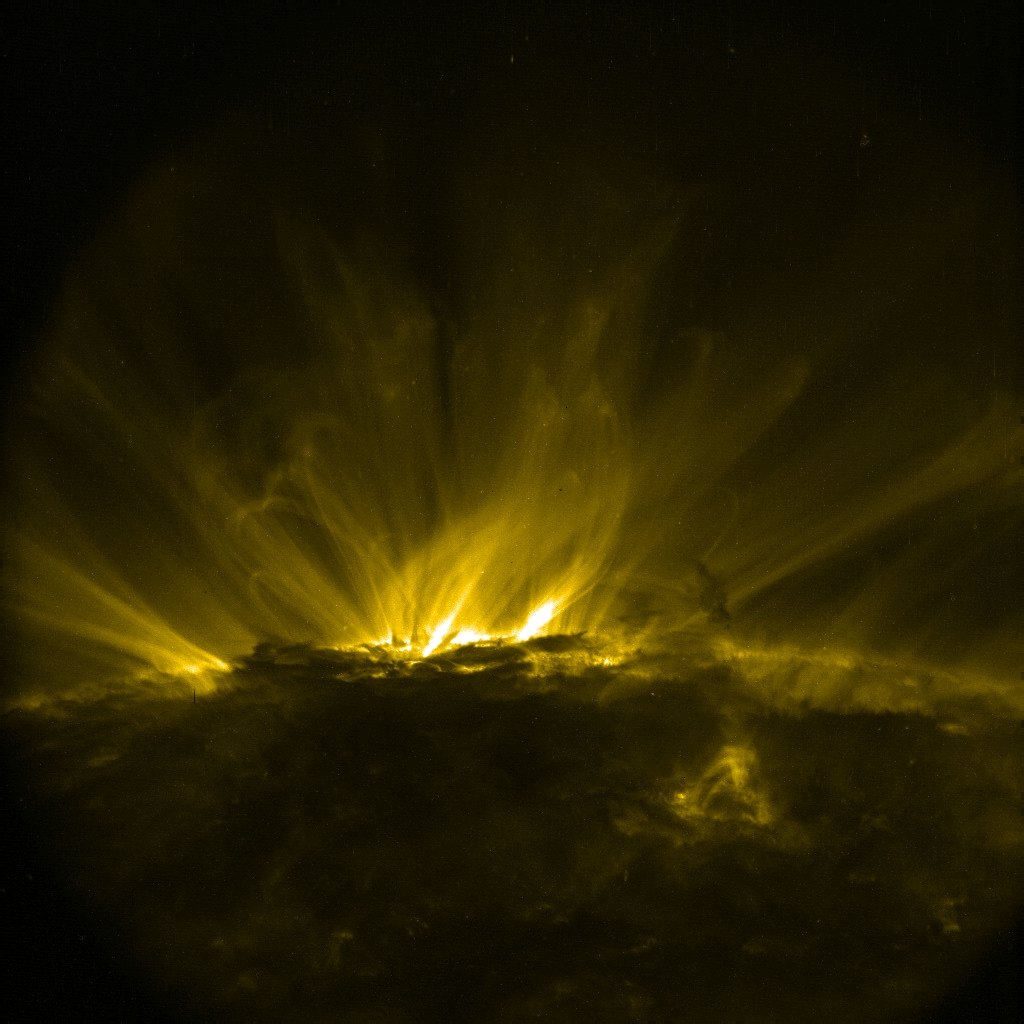 |
This TRACE 171Å image shows a sizeable active region at the
east limb of the Sun (rotated clockwise 90 degrees so north is to the right)
just as it rotates onto Earth-facing hemisphere. Notice the low-lying dark
structures of filaments at the leading edge of the region, some
'levitating' dark material on the right-hand side of the region, and
the small ephemeral region towards the lower right.
This region was the source of several B and C-class flares on the day
of observation (2006/11/08 at 03:01:02 UT) and on the day before, including
some coronal mass ejections.
|
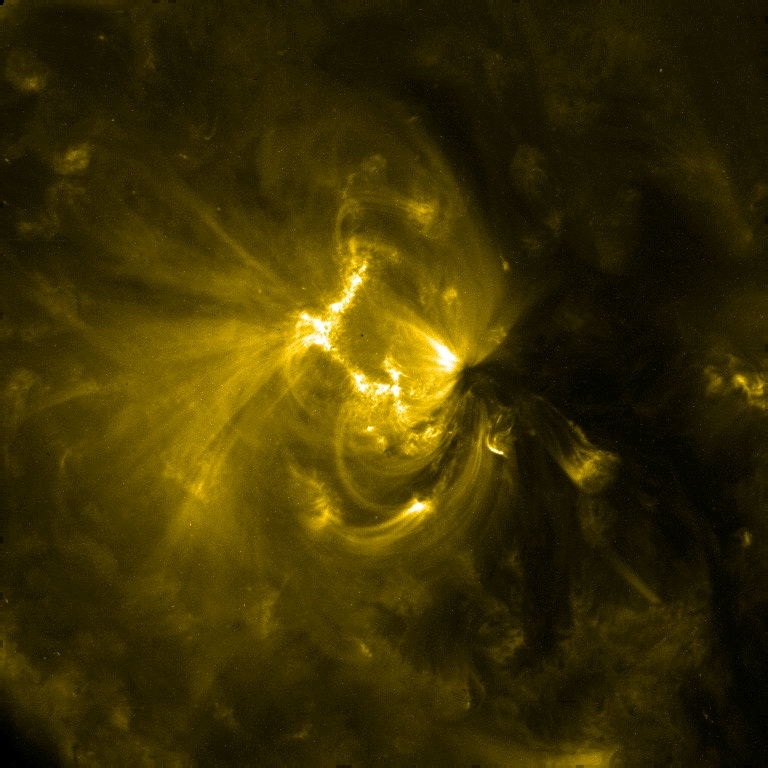 |
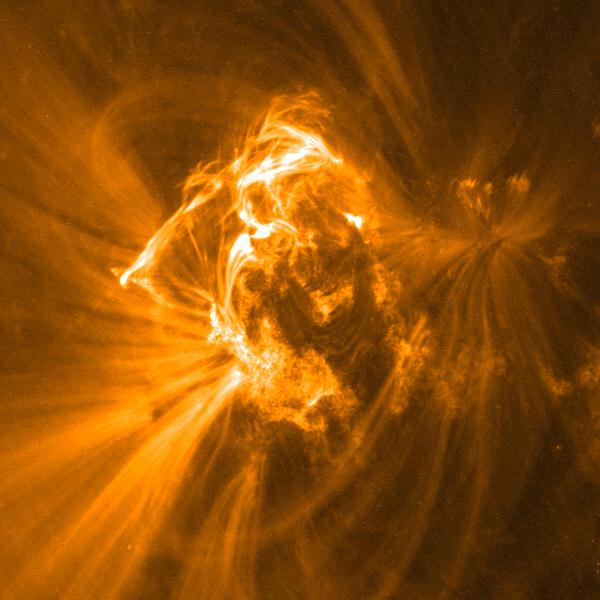
The image shows
NOAA Active Region 10961 as observed by TRACE in its 171Å passband
at 05:14:32 UT on June 29, 2007 (showing a 768x768 pixel field of view).
This region is characteristic of a mature, quiescent region: many
relatively cool loops (around 1 million Kelvin) connect the two polarities,
arching high over the hotter interior, which reveals itself in this
TRACE image only because of the brightly mottled transition region
emission (commonly called 'moss') in the interior of the region. The
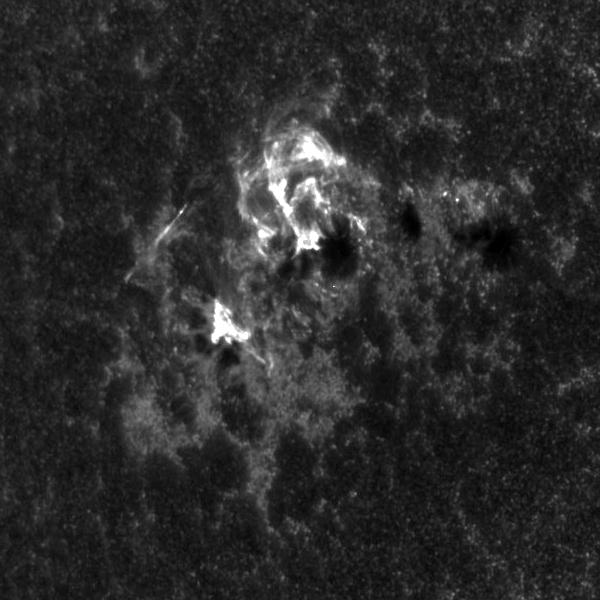
171Å image shows an EUV-dark region to the west (right) of the
active region. This dark region appears to comprise to very different
components: The south-pointing spur is likely a filament, i.e., a
region of relatively dense and cool gas that absorbs, rather than
emits, EUV emission; this filament is rather weak, however, as
can be seen in this H-alpha image. The dark region
directly westward of the leading sunspot, however, appears to be
associated with a coronal hole, i.e., a region where the magnetic field
is open to the heliosphere, from which the solar wind flows into
interplanetary space. This is supported by the potential-field
source-surface (PFSS) model. In this image, the closed
field lines are shown in white on a TRACE 1024x1024 pixel image taken
at 15:17:45 UT, while open field lines are shown in purple.
TRACE image courtesy of Antonia Savcheva (SAO).
|
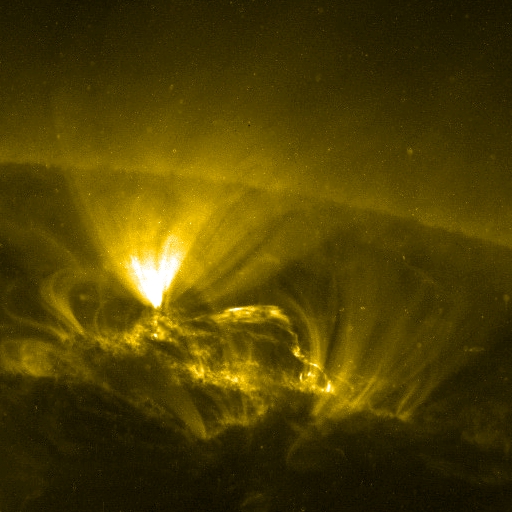 |
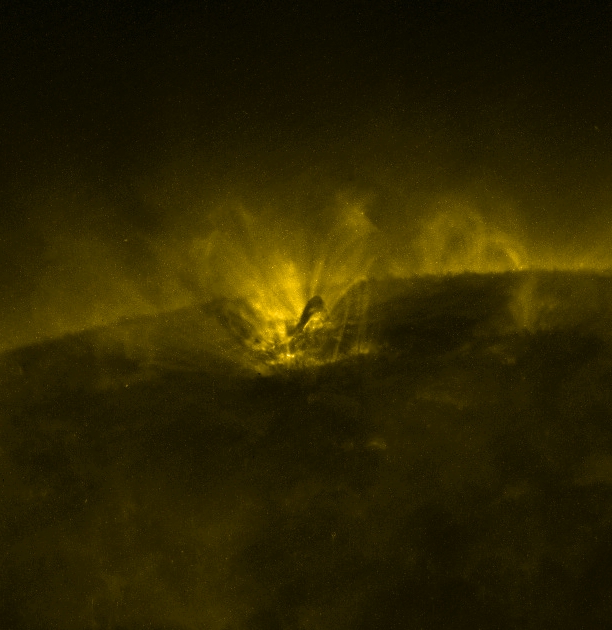
On 2007/07/18, TRACE observed a relatively small active region in its
171Å pass band (image rotated by 90 degrees counterclockwise; a
512x512 pixel cutout is shown at full resolution, with about 350 km per pixel).
Around 17UT, part of the coronal field activated, as shown in this
(10MB) quicktime movie
spanning roughly an hour of solar observations. But it did not affect
the corona around it very much: the surrounding magnetic fields shows
little, if any, change.
Movie courtesy of Trish Jibben (SAO).
|
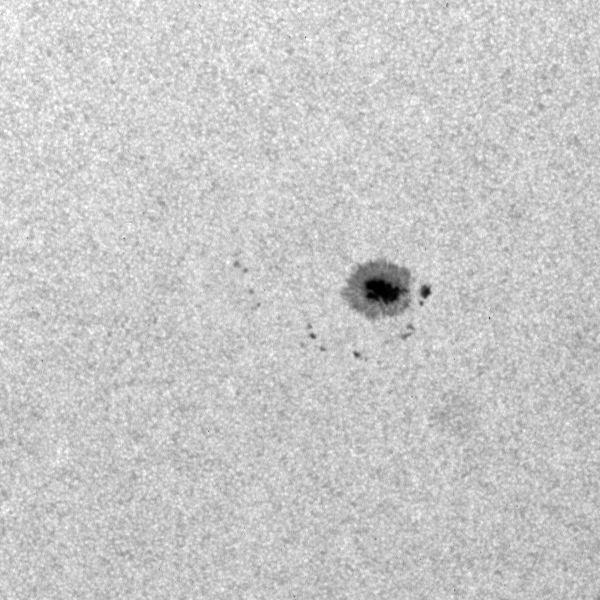 |
This (3MB) white-light movie shows the evolution of a small sunspot with surrounding pores, as observed by TRACE in its white-light channel for almost a full week (from 2007/06/29 05:40 UT through 2007/07/04 22:44 UT). There are a train of satellite pores moving away from the main spot(s), even as light bridges form and segments of the umbra separate from the residual spot. Despite all that activity, there were no substantial flares, and the GOES X-ray level remained mostly under A. A coronal snapshot, taken in the 171Å channel at 2007/07/03 03:37 UT, is shown above; the corresponding white-light image to the left was taken 6 seconds later. Images and movie courtesy Aki Takeda (MSU). |
 |
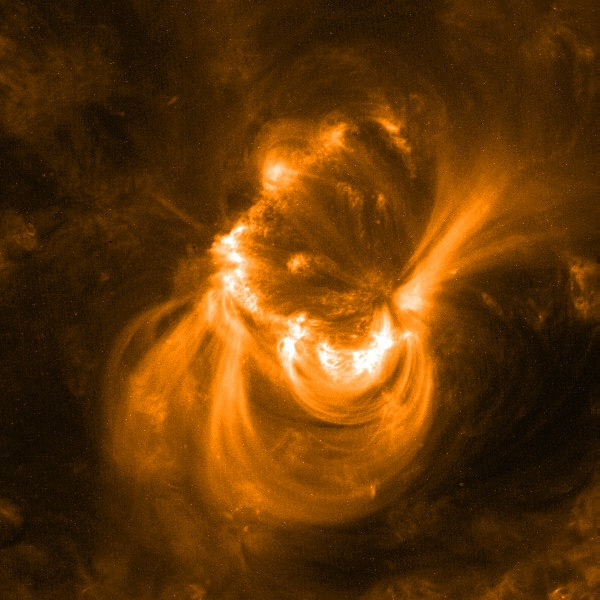
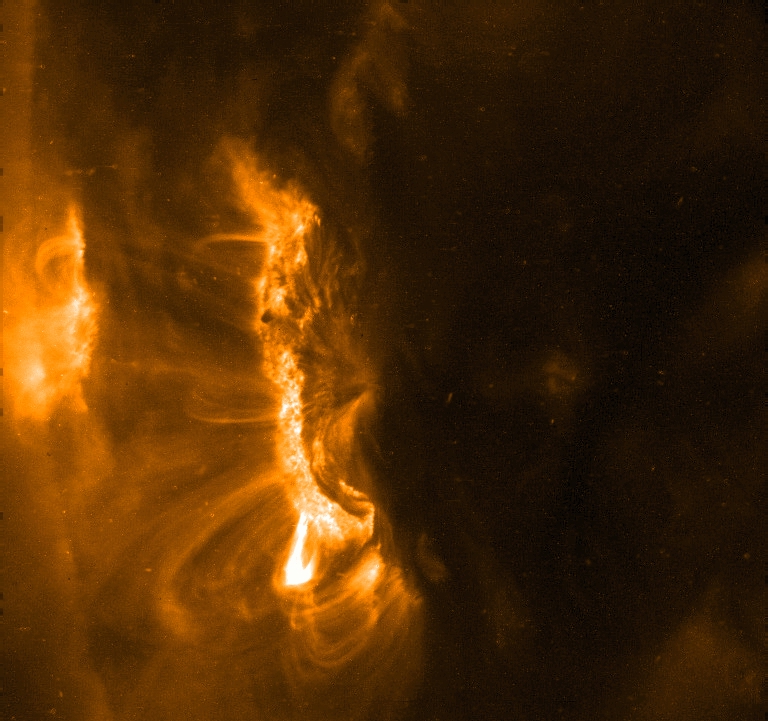
Tens of intertwined arches appear in the last glimpse of NOAA Active
Region 10960, which spruced up the previously-bare Sun with several small
flares. A river of cold plasma, shown as a black band underneath the
central arch, seems to connect the roiling active region to a patch of
quiet Sun. The central arch spans some 300,000 kilometers, which is about
3/4 of the distance between the Earth and its Moon.
The image was taken on 2007/06/14 at 00:28 UT in the TRACE 171Å channel.
Courtesy Monica Bobra (SAO).
|
 |
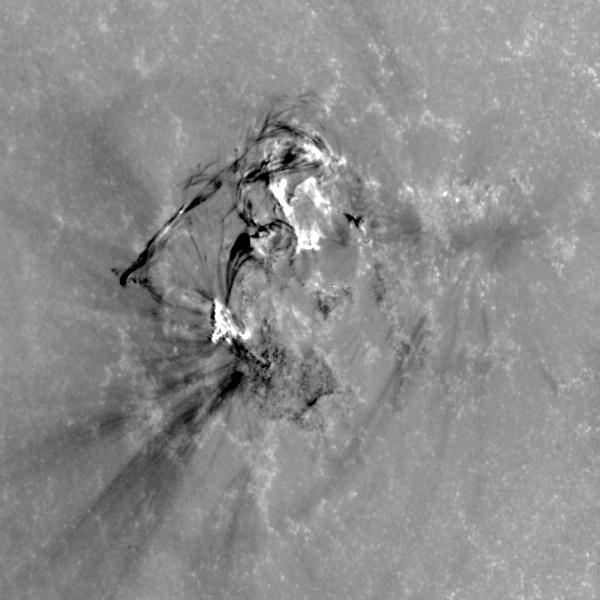 Even with the Sun in the minimum of its activity cycle, major flares do occur: NOAA Active Region 10690 produced multiple M-class flares and a series of lesser flares. The image to the left shows the M8.9 flare on June 4, 2007, observed in the 171Å passband: it shows the brightened set of loops that wrap around each other in the north-eastern part of the active region (see a short movie in the TRACE flare catalog for 2007); unfortunately, TRACE did not observe the initial phase of the flare, as the spacecraft was then behind the Earth. The middle image shows a 1600Å image of the transition region: bright regions are seen at the base of the complex flaring loop system on both of its ends on the solar surface. The third image, a difference image of the first two, shows this clearly: the EUV-bright loops (here dark) end in the UV-bright areas). The above images are 600x600 pixel
cutouts of the 1024x1024 images, shown at the full resolution of
0.50 arcseconds per pixel.
Flare images courtesy Aki Takeda (MSU); the TRACE flare catalog is
maintained by Trish Jibben (SAO).
|
 |
On May 23, 2007, TRACE observed an eruption in NOAA Active Region 10956:
the 4MB QT movie shows how a
segment of a filament appears to be squeezed out from one side of
a loop arcade (this 171Å movie covers the period from 7 UT to 8 UT).
Notice how the arcade's southern end
moves slightly northward during the eruption, to relax to essentially
its pre-eruptions state immediately afterward. Courtesy of Dawn Myers (GSFC).
|
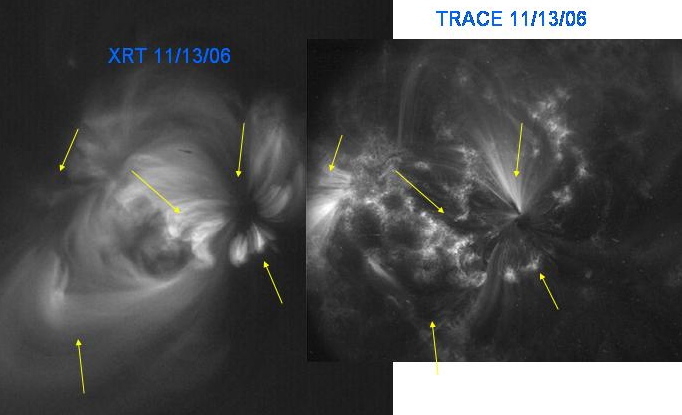 |
The Hinode X-Ray Telescope is mostly sensitive to light emitted by hotter gases
in the solar outer atmosphere than the TRACE channels. The image on the left
is a comparison of an XRT image of an active region (left) and a TRACE
171Å image of that same region. The five arrows in each of the panels
point to corresponding locations on the Sun; notice how fans of bright loops
in one image correspond to dark regions in the other, and how many of
the hotter loops seen in XRT end in bright 'moss' regions seen in the
TRACE image.
Image courtesy Leon Golub (SAO).
See also this comparison for 2006/11/01.
|
 |
During cycle minimum, there are very few active regions. Here is an
image of the only such region visible on the disk on 2007/04/27:
Active REgion 10953. Image courtesy of Dawn Myers (at GSFC).
|
 |
On March 13, 2007, TRACE observed a small active region near the west limb of the Sun in its 171Å passband. This
(7.5 MB) QT movie shows
the region for half a day, with roughly one exposure per minute. There was no
flaring on that day that brought the GOES X-ray flux above A3,
characteristically low for the Sun near cycle minimum. But that does not mean
that nothing happens in this region: notice the many cool, dark sprays and
surges as the chromosperic plasma responds to the evolution of the Sun's
magnetic field, and notice how rapidly the coronal bright loops above the
surface evolve both in brightness and in position.
Entry suggested by Antonia Savcheva (SAO).
|
|
| Home | Mission | Instrument | Team | Operations | Results | Images | Movies | Education | Site Info. | |