

The TRACE images may be used without restrictions
in publications of any kind. We
appreciate an acknowledgement indicating that
the Transition Region and Coronal Explorer, TRACE,
is a mission of the Stanford-Lockheed Institute for Space
Research, and part of the NASA Small Explorer program. More information on
TRACE and other TRACE images can be found
here.
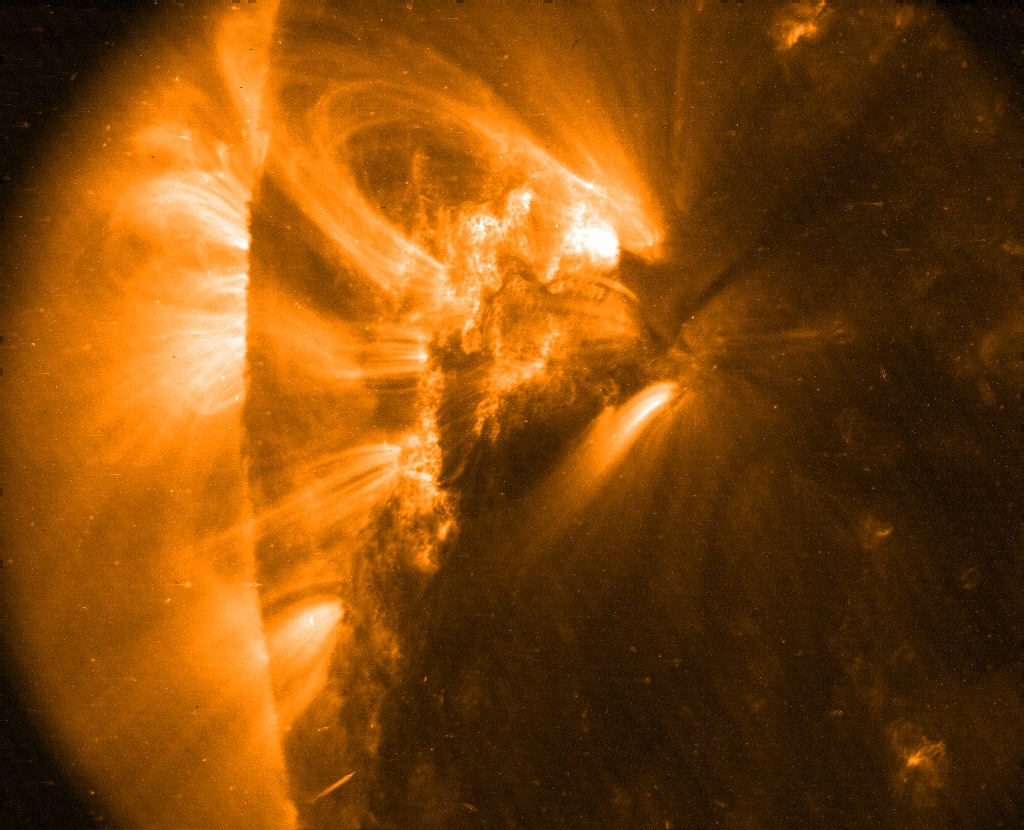 |
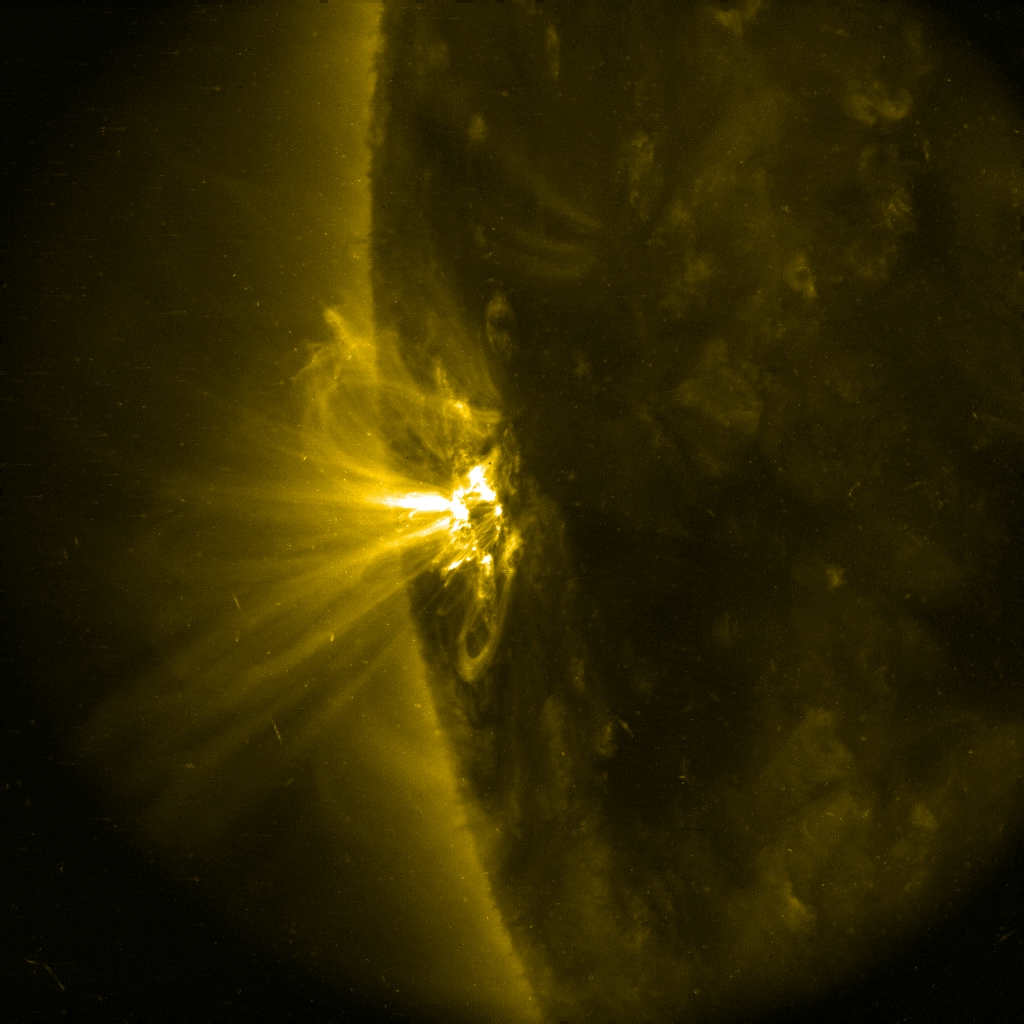
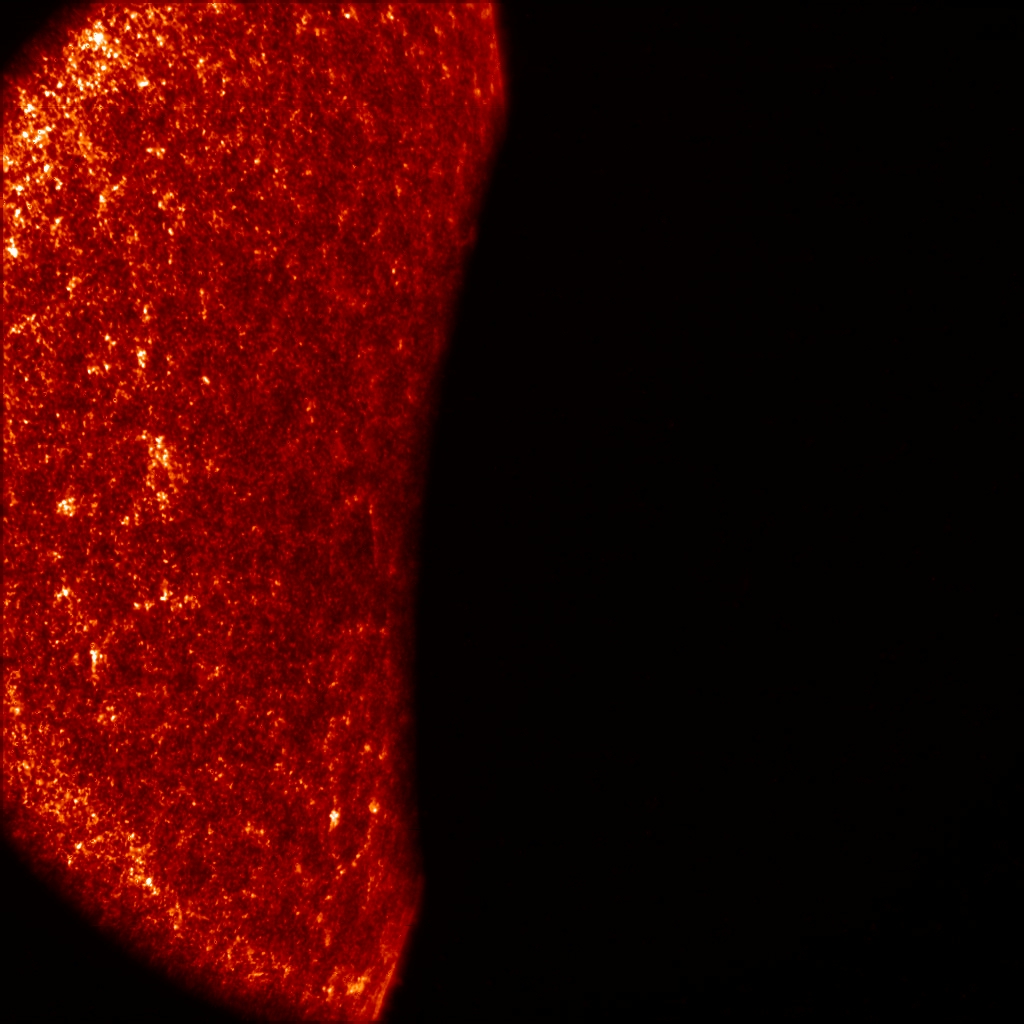
The Sun's current sunspot cycle is coming to an end, but still a few active
region emerge with the old cycle's polarity,
now very close to the solar equator. This is an image of one of them,
Active Region 10980, observed on 2008/01/03 in TRACE's 171Å channel,
around 00:52 UT. Courtesy Dawn Myers (GSFC).
|
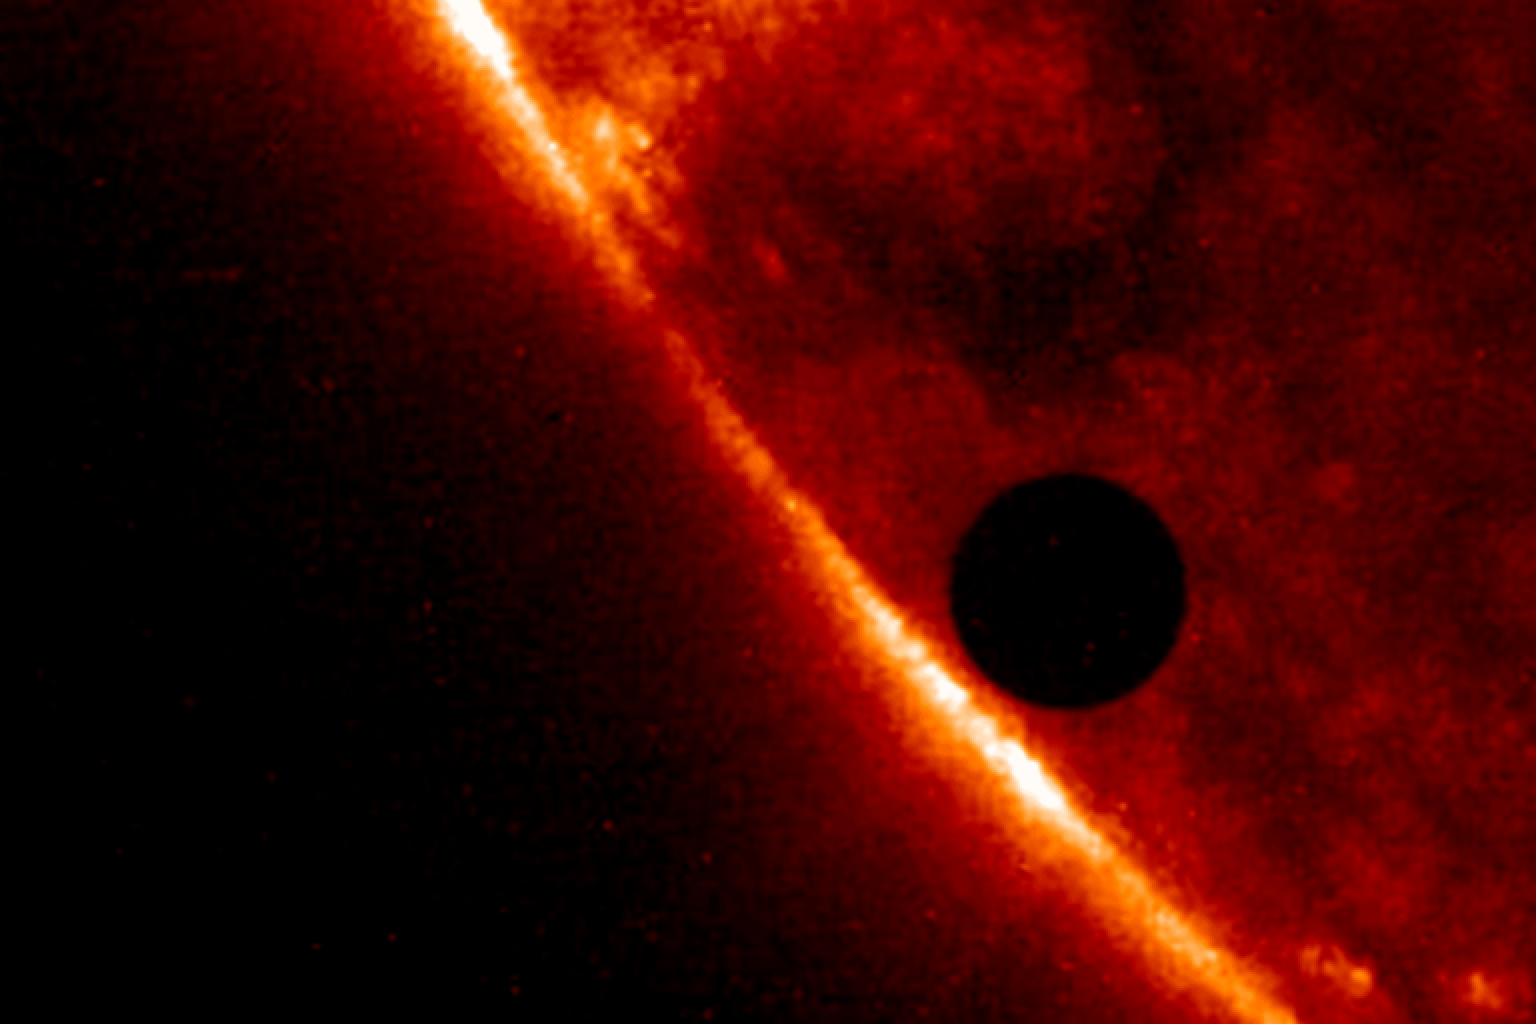 |
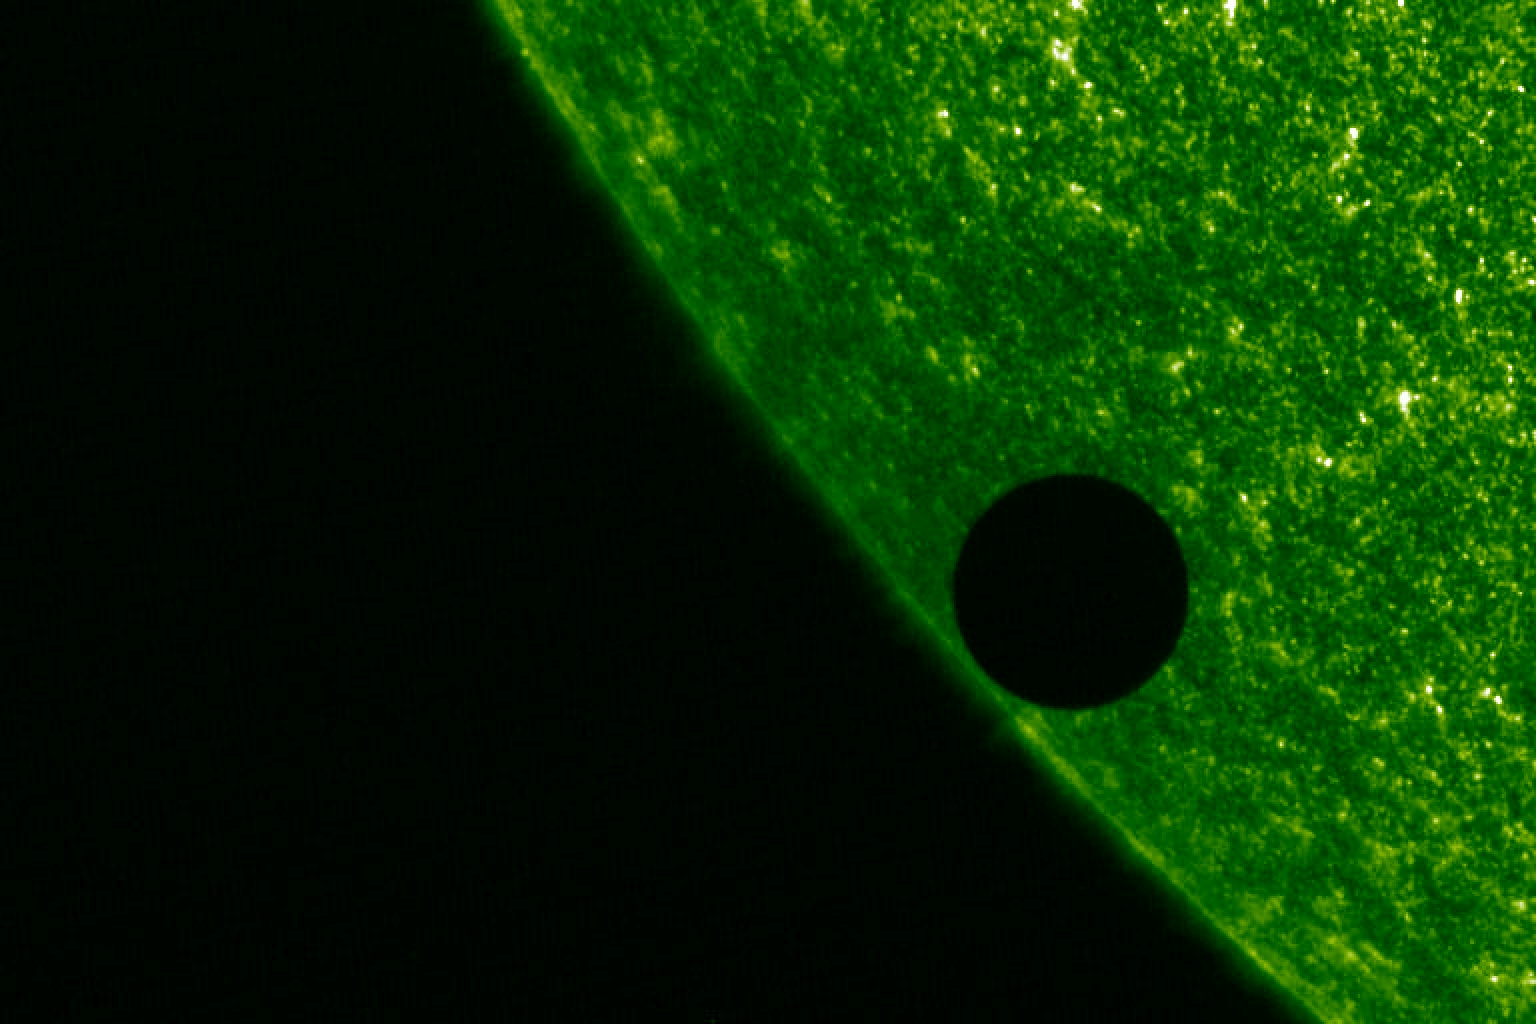

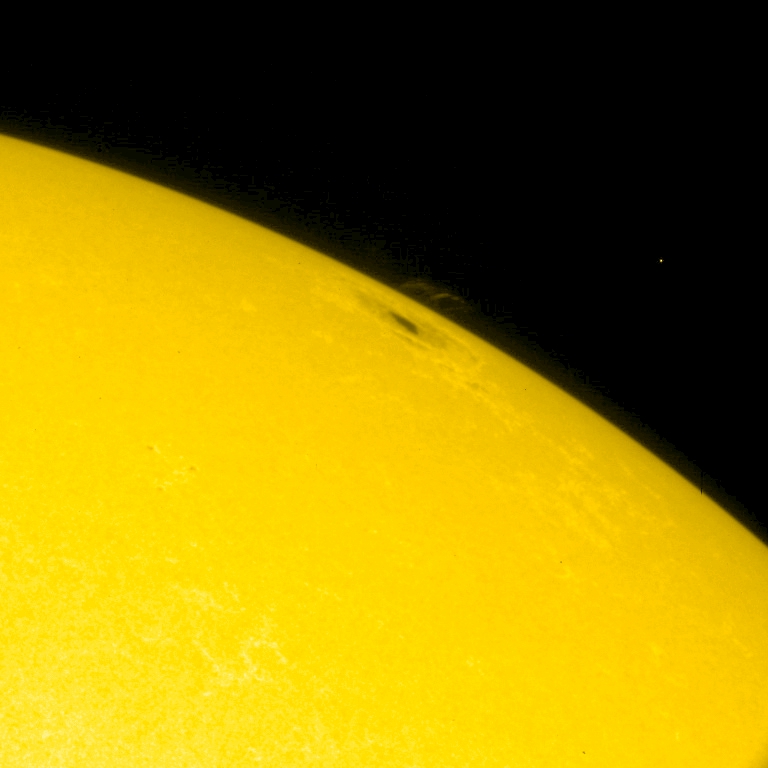
The Venus transit revisited:These three images show Venus at the start of its 2004/06/08 transit. The images were taken in the coronal 171Å, transition-region 1600Å, and white-light channels of TRACE. The 171Å image was taken at 05:39:17 UT, the 1600Å one only 4 seconds later, and the visible-light image 27 seconds earlier. These times differ so little that Venus moved very little in that period relative to the Sun. This reveals an interesting phenomenon about the Sun: the Sun's apparent size depends on the color of the light used to observe it. This is clearly visible in this set of images: in the visible-light image, Venus just touches the edge of the Sun, but it appears to lie well away from it on the other two images: the Sun appears to be almost 10,000 km larger in the extreme ultraviolet 171Å image than it is to the naked eye. The same effect was seen years before with TRACE during the 1999 Mercury transit. |
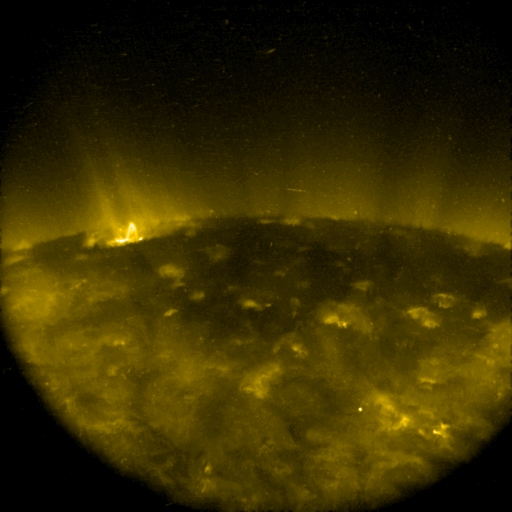 |
This image (taken by TRACE on 2007/12/01 at 04:11:03) shows the north polar
region of the Sun (shown 2x2 binned). The image shows the well-developed
polar coronal hole as a dark area in the center of the field of view. The
hole and the surrounding faintly glowing quiet corona are filled with
coronal bright points over small, ephemeral bipolar regions on the solar
surface. One of the larger of
these, left of center near the solar limb, shows a bright, compact loop that
lit up temporarily. Around it, the field outlined by the EUV emission
from the million-degree
plasma shows the stalk of a polar plume, from which coronal matter
flows out from the Sun into the heliosphere.
Image courtesy of Samaiyah Farid (SAO).
|
 |
 Active Region 10978, one of the last in Sunspot Cycle 23, showed relatively little activity and change as it crossed to solar disk. These two images were taken a week apart (2007/12/06 at 12:23:18 - left - and 2007/12/13 09:21:00 - above), giving two different views of the region. Note how the high-arching loops above the solar limb transform into fans of loops (primarily towards the left - East), which are so faint high above the solar surface that their top segments do not show up on the 2nd image, in which the region is viewed from above. |
 |
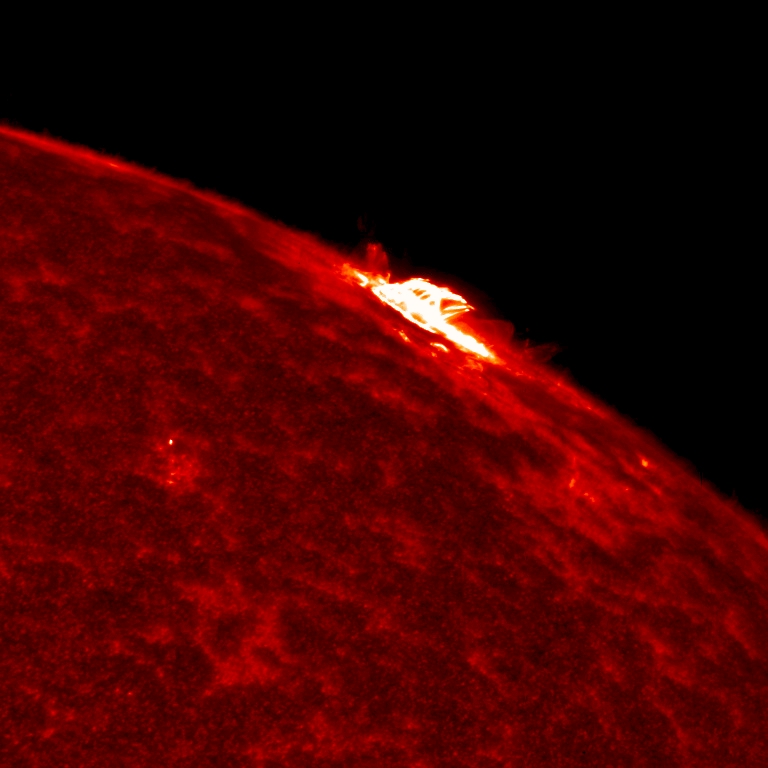
On 22 November 1998, TRACE observed an X3.7 flare at the solar limb. The image on the left is a TRACE "white-light" image (rotated 90 degrees clockwise so that north is to the left) taken at 16:49 UT, some 25 minutes after the peak brightness in the X-ray light curve. At that time, strong, bright coronal structure are cooling down from multi-million degree temperatures to tens of thousands of degrees and below. That material, sliding back towards the solar surface as it cools, is faintly visible in this image, hovering in multiple coronal loops above the main sunspot in the active region. In the ultraviolet (1600Å) image in the middle, these loops are much more clearly outlined, standing out brightly above the solar surface. In the EUV (171Å) image on the right, these loops outshine anything else in their vicinity, and in fact anywhere else on the Sun at that time. Seeing flares in "white light" is rare: had this flare occurred with
the region on the disk rather than at the limb, we would not have noticed
the faint glow of the cooling loops in the TRACE WL channel. We believe
we only see them in this image because TRACE's white-light channel is
rather sensitive to ultraviolet contributions, which is likely the
wavelength range at which these cooling loops were brightest.
|
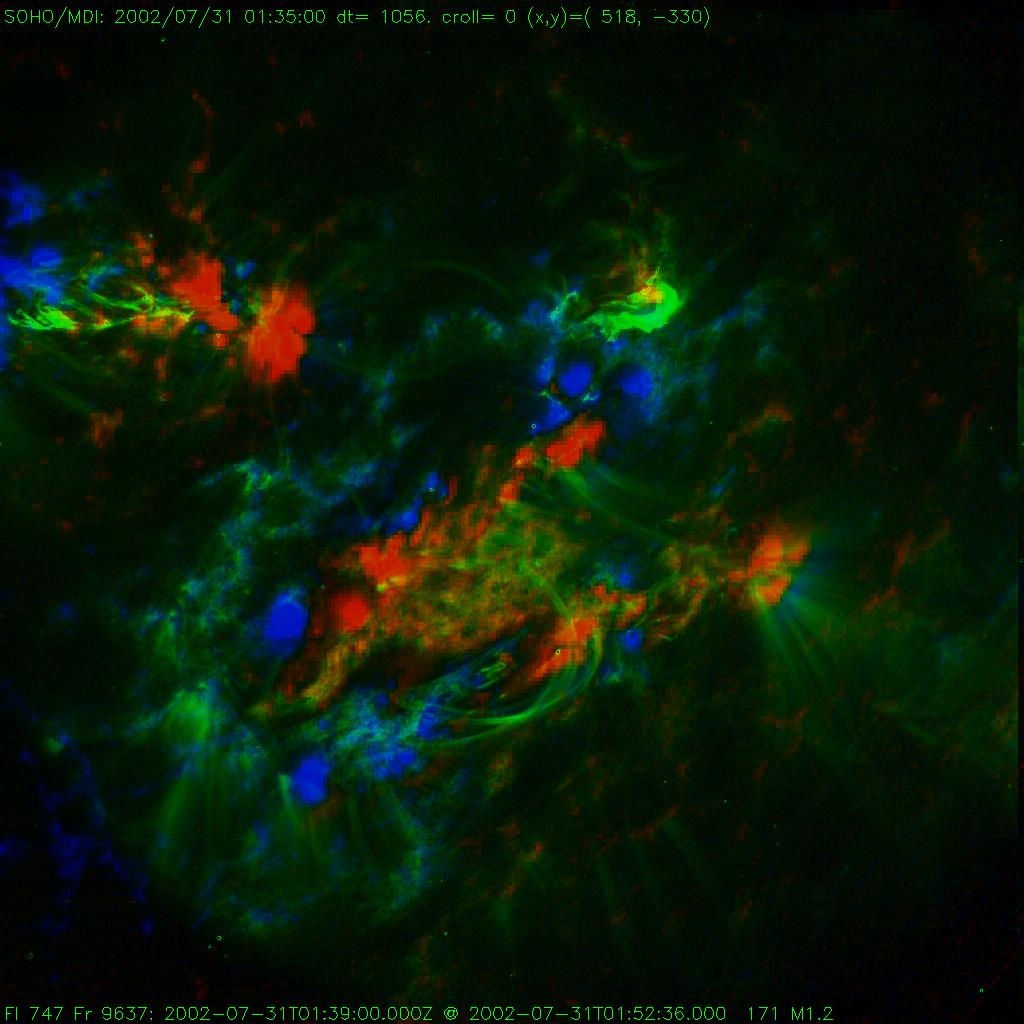 |
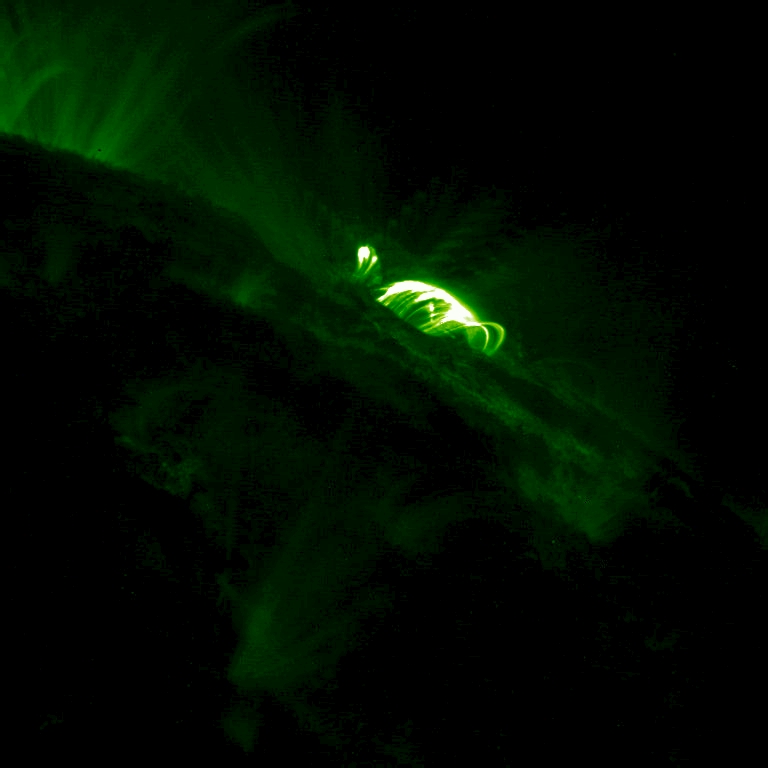
 Flares are almost always confined to the active region in which they start, but here is an interesting exception: the image above two adjacent regions that flare nearly simultaneously. The image (taken by TRACE at 2002/07/31 01:52:14 UT in its 171Å passband) shows an area on the Sun with multiple active regions in close proximity. Two small ones are visible in the top half of the image, one near the lefthand edge, and one well westward (right) of that; the image to the left shows this coronal image overlaid on a SOHO/MDI magnetogram (with red and blue for the opposite magnetic polarities). The small active region on the right exhibited an eruption just prior to the time this image was taken, and the region to the left - to which it is magnetically connected - responded by a sympathetic flare almost immediately; the TRACE image shows both flares in progress. The GOES X-ray signal of these events shows only a single spike in the light curve, peaking at the equivalent of an M1.2 flare. |
 |
The big picture VTRACE's field of view covers only a fraction of the entire Sun, but by repeatedly repointing, it can create an image of the entire solar corona. This three-color image shows the solar corona on 2007/09/15 in three extreme ultraviolet channels simultaneously: the 171Å channel (most sensitive to emission from 1 million degree gases) in blue, the 195Å channel (1.5 MK) in green, and (hardly visible for this inactive Sun) the 284Å (2 MK) in red.The image (rescaled to 1500 by 1500 pixels to a side) shows a very inactive corona with the sunspot cycle at its minimum. Most of the solar surface is covered with compact ephemeral regions, and a few coronal holes (including the polar cap holes). Little material at 2 million degrees or above is present; hence the 'cool' blue-green look. Note some of the image artefacts: weak absorption in the Earth's atmosphere that occurs during some phases of TRACE's orbit cause some patches to look dimmer than others, causing the edges between the different panels to be visible for several of the 26 pointings needed to complete this image. P.S. There is also a 2.1MB 4500x4500 pixel version of this image. Other 'big-picture' full-disk mosaics in the TRACEpod collection
can be found here:
1,
2,
3, and
4.
|
 |
Even during the minimum phase of the sunspot cycle, much magnetic flux continues to emerge on the Sun. Most of this is in the form of relatively small 'ephemeral regions.' This image shows the north polar region of the Sun, as observed by TRACE in its 171Å passband on 2007/09/25 at 10:18:03 UT: a multitude of coronal brightenings is visible over the small magnetic regions underneath on the solar surface. The darkest regions are parts of the polar coronal hole that has formed over the past year. It is from this polar region, and its southern counterpart, that much of the solar wind originates around the time of sunspot minimum.
|
 |
On 2007/09/11 the Moon moved in front of the Sun three times as seen
from the TRACE orbit. This 4-minute
(1.5MB; 2x2 binned)
movie shows the first of these, as seen through TRACE's
1600Å channel. The Moon moves fast, not only because of its
orbital motion around the Earth, but primarily because TRACE is moving
fast in its own orbit, causing the fast perspective motion of the Moon
in the other direction relative to the Sun. The image on the left
shows the full resolution version of the image taken at 11:03:30 UT.
Courtesy Dawn Myers (GSFC) and Aki Takeda (MSU).
|
 |
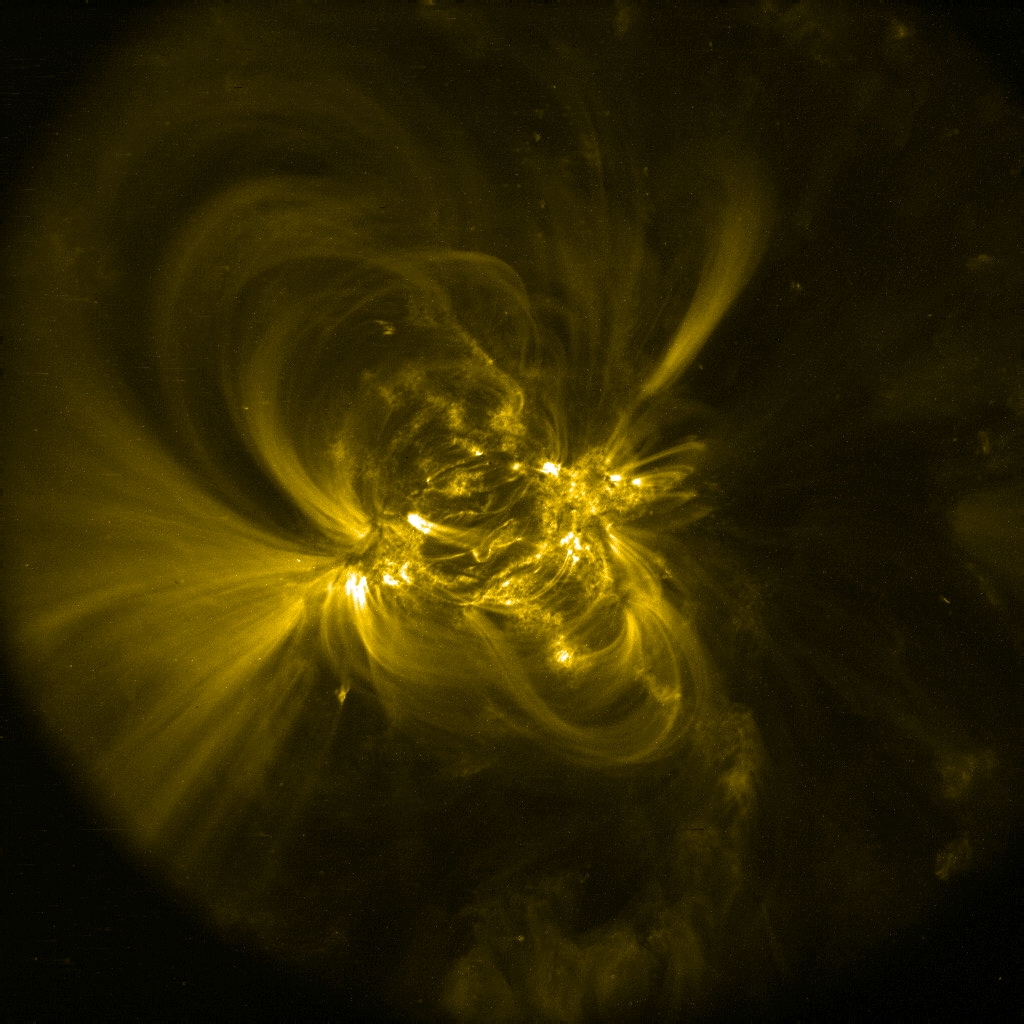
On 2007/08/28 at 05:17:20 UT, TRACE took this image of NOAA Active Region
10969 in its 171&ARing; passband (most sensitive to emission from gases
with temperatures near 1 million Kelvin). This small region showed little
activity, other than some low-level flaring and the usual evolution
of coronal loops. The fan of loops pointed towards the right originates
in a small, coherent sunspot. Much of that field arcs back over the
region towards the east (left) to end in a patch of bright moss, which is
the transition region where the temperature drops rapidly from above
a million degrees to very much below that. This region is very typical
of 'active regions' seen during the minimum in the sunspot cycle.
Image courtesy of Samaiya Farid (SAO).
|
|
| Home | Mission | Instrument | Team | Operations | Results | Images | Movies | Education | Site Info. | |